By Shawn Gibson on Jul 18, 2023

FUND OVERVIEWS
The Overlay Shares suite of ETFs seeks to provide incremental yield on top of low-cost market beta ETFs by utilizing a highly risk-controlled put spread writing strategy ("the Overlay Strategy") on the S&P 500 Index. If successful, we believe the ETFs have the ability to provide higher yield and higher total return than holding the underlying ETFs alone. The Overlay Strategy is applied and managed the same way in all seven of the Overlay Shares funds:
| FUND NAME | BETA EXPOSURE | INCEPTION DATE | GROSS EXPENSE RATIO |
| Overlay Shares Large Cap Equity ETF (OVL) | US Large Cap Equity | 09/30/2019 | 0.80% |
| Overlay Shares Small Cap Equity ETF (OVS) | US Small Cap Equity | 09/30/2019 | 0.84% |
| Overlay Shares Foreign Equity ETF (OVF) | International Equity | 09/30/2019 | 0.99% |
| Overlay Shares Core Bond ETF (OVB) | Broad Investment Grade Bond | 09/30/2019 | 0.80% |
| Overlay Shares Municipal Bond ETF (OVM) | Municipal Bond | 09/30/2019 | 0.84% |
| Overlay Shares Short Term Bond ETF (OVT) | Short Term Corporate Bond | 01/14/2021 | 0.81% |
| Overlay Shares Hedged Large Cap Equity ETF (OVLH) | Hedged US Large Cap Equity | 01/14/2021 | 0.88% |
In addition to generating income through the Overlay Strategy, the Overlay Shares Hedged Large Cap ETF (OVLH) maintains laddered downside hedges to help reduce significant market drawdowns.
PERFORMANCE OVERVIEW
The strength of the equity markets continued to surprise many investors, as the S%P 500 Index gained 8.74% for the quarter, bringing the YTD return to +16.89%. Small Cap and International stocks have also produced nice returns, albeit lower than U.S. large cap stocks that have benefitted from a strong run in mega cap tech stocks. The fixed income markets generally experienced modest losses for the quarter, but the US Aggregate Bond Index is still up 2.09% YTD.
The Overlay Shares have not only benefitted from the gains in the various asset class betas, but they have also benefitted from positive performance from the Overlay Strategy, which is a core component of all of the ETFs. The estimated attribution to the funds was a positive 1.12% on a gross basis for the 2nd quarter, bringing the YTD gross attribution to 1.91%. This performance has provided positive excess return in the funds relative to the various underlying ETFs. As the table below shows, the Overlay Shares Large Cap Equity ETF (OVL), Overlay Shares Core Bond ETF (OVB), and Overlay Shares Municipal Bond ETF (OVM) have outperformed their benchmarks over the short-term and since inception despite a poor environment for the Overlay Strategy in 2022. All 3 funds are ranked by Morningstar in the top 10% of their peer group YTD and in the top 15% since inception. The Overlay Shares Hedged Large Cap (OVLH) continues to meet our expectations, providing investors with significant equity appreciation potential while mitigating downside risk.
FUND PERFORMANCE
| Q2 23 | YTD | 1 YEAR | 3 YEARS | Inception to Date | |
| OVL NAV Returns | 9.70% | 18.50% | 19.31% | 15.04% | 13.53% |
| OVL Market Price Returns | 9.92% | 18.80% | 19.88% | 14.81% | 13.56% |
| S&P 500 Total Return Index | 8.74% | 16.89% | 19.59% | 14.60% | 13.18% |
| Morningstar LC Blend Category Rank % | 11 | 10 | 31 | 20 | 15 |
| OVS NAV Returns | 4.34% | 7.54% | 9.65% | 15.47% | 8.84% |
| OVS Market Price Returns | 4.46% | 7.56% | 10.10% | 15.50% | 8.88% |
| S&P 600 Total Return Index | 3.38% | 6.03% | 9.75 | 15.19% | 8.52% |
| Morningstar SC Blend Category Rank % | 51 | 52 | 78 | 32 | 45 |
| OVF NAV Returns | 2.78% | 9.63% | 9.69% | 4.25% | 1.69% |
| OVF Market Price Returns | 2.80% | 9.21% | 9.82% | 4.11% | 1.67% |
| MSCI All Country World ex USA Index | 2.44% | 9.47% | 12.72% | 7.22% | 4.86% |
| Morningstar Foreign Blend Category Rank % | 57 | 74 | 95 | 95 | 95 |
| OVB NAV Returns | -0.03% | 3.78% | -0.82% | -3.44% | -1.01% |
| OVB Market Price Returns | -0.33% | 3.47% | -0.96% | -3.75% | -1.07% |
| Bloomberg US Aggregate Bond Index | -0.84% | 2.09% | -0.94% | -3.96% | -1.59% |
| Morningstar Inter. Core Bond Category Rank % | 6 | 2 | 45 | 27 | 15 |
| OVM NAV Returns | 0.64% | 3.83% | 3.00% | 0.11% | 0.97% |
| OVM Market Price Returns | 0.61% | 3.77% | 3.09% | -0.01% | 0.97% |
| Bloomberg Municipal Bond Index | -0.10% | 2.67% | 3.19% | -0.58% | 0.28% |
| Morningstar MuniNational Category Rank % | 5 | 2 | 31 | 17 | 4 |
| OVT NAV Returns | 0.93% | 3.32% | 1.90% | N/A | -1.96% |
| OVT Market Price Returns | 1.00% | 3.28% | 1.95% | N/A | -1.95% |
| Bloomberg US Corporate 1-5 Years TR Index | 0.07% | 1.75% | 1.72% | N/A | -1.77% |
| Morningstar Short Term Bond Category Rank % | 8 | 4 | 35 | N/A | 73 |
| OVLH NAV Returns | 7.01% | 11.63% | 11.73% | N/A | 4.89% |
| OVLH Market Price Returns | 7.55% | 11.66% | 12.20% | N/A | 4.97% |
| S&P 500 Total Return Index | 8.74% | 16.89% | 19.59% | N/A | 8.37% |
| Morningstar Options Trading Category Rank % | 17 | 44 | 70 | N/A | 50 |
*Inception for OVL, OVS, OVF, OVB, OVM is 09/30/2019. Inception for OVLH and OVT is 01/14/2021.
Performance data quoted represents past performance and is no guarantee of future results. Investment return and principal value of an investment will fluctuate so that an investor's shares, when redeemed, may be worth more or less than their original cost. Current performance may be lower or higher than the performance data quoted. For the most recent month-end performance, please call 1-866-704-OVLS.
Overlay Shares are bought and sold at market price (not NAV) and are not individually redeemed from the Fund. Total Returns are calculated using the daily 4:00pm EST net asset value (NAV). Market price returns reflect the midpoint of the bid/ask spread as of the close of trading on the exchange where Fund shares are listed. Market price returns do not represent the returns you would receive if you traded shares at other times.
MARKET OVERVIEW
Over time, the Funds are expected to benefit from the attribution from the Overlay Strategy. The strategy benefits from a number of key factors: 1) options are wasting assets making it more advantageous to sellers over the long term; 2) sharp market declines tend to be much less frequent than flat or rising markets; and 3) options are chronically overpriced (resulting in a chronic volatility risk premium). Since the end of the 3rd quarter of 2022, all three of these factors have worked to the advantage of the strategy, adding positive attribution and excess return for all 7 funds.
A challenging market for the strategy occurs when there are repeated sharp declines in the equity market, resulting in the premiums collected in the strategy being insufficient to cover the payouts during these periods. The first 3 quarters of 2022 were a classic example of that. From 1/3/2022 to 10/14/2022, 56% of the 5-day periods and 63% of the 10-day periods for the S&P 500 Index were negative and had average losses during those times of -3.02% and -3.91%, respectively. Conversely, from 10/17/2022 to 6/30/2023, the percent of down 5-day and 10-day periods dropped to 40% for 5-day and 33% for 10-day with average market drawdowns in those periods coming down to -1.39% and -2.05%, respectively. These stats portray very different equity market backdrops, the first clearly having a strong negative bias with large negative returns during times throughout the year, while the latter period shows significantly more stability and positive market tailwinds. This positive change in market backdrop coincided directly with the improvement of the Strategy returns.
| S&P 500 TR Index | 01/03/2022 - 10/14/2022 | 10/17/2022 - 06/30/2023 |
| % Neg 5-Day Periods | 56.06% | 40.11% |
| Average Neg 5-Day Return | -3.02% | -1.39% |
| % Neg 10-Day Periods | 63.64% | 32.77% |
| Average Neg 10-Day Return | -3.91% | -2.05% |
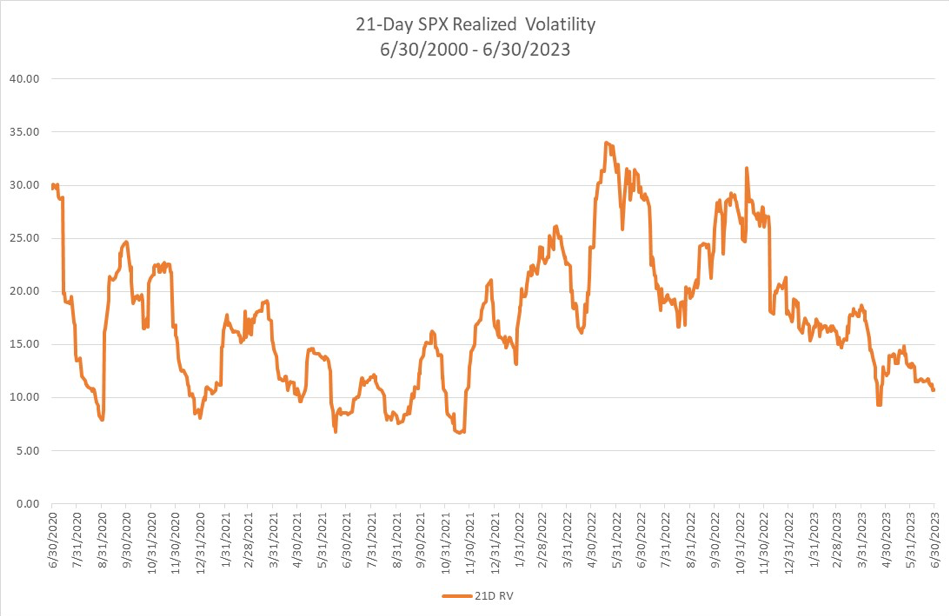
Another simple way to view this is by looking at the realized volatility of the S&P 500 Index. For most of 2022, realized volatility was rising and in some cases had major spikes higher. Rising volatility and volatility spikes are very challenging for the Strategy. Starting in October 2022, realized volatility began a major compression, dropping from over 30% to just under 10% at one point. This clearly shows the shift from a high volatility environment back into a low/normal volatility environment.
It is important to note that over the long term, low/normal volatility regimes (which tend to favor the Strategy) last 3-5 years. Should history repeat itself (or at least rhyme), this could set up an attractive opportunity set for the Strategy for a significant period of time. While many market participants and the press that speak with them continue to have concerns and doubts about the markets, economy…etc., investors have clearly returned into a "buy the dip" mentality which has driven the stats provided before. Even when "negative" news has come out and it seems like there should be a strong negative reaction, the reactions have tended to be brief and muted, and oftentimes surprisingly positive.
A move back into a high volatility regime will require a market shock type of catalyst (the FOMC hiking another 75 basis points instead of 50 is not that). Examples could include: 1) a broadening of the banking crisis earlier this year; 2) an invasion of Taiwan by China; 3) a sustained return of sharply higher inflation that causes a potential FOMC terminal rate to be extremely unpredictable; and 4) the event that no one is concerned about right now. An example of #4 would be the impact of sustained higher rates on non-investment grade borrowers. A scenario could be envisioned whereby borrowing costs spike as loans come to maturity and need to be reset over the coming years. This would put tremendous pressure on the balance sheets and cash flow of these companies, and could have spillover effects into the broader markets. While there are always things to worry about, as things stand today the opportunity set is too favorable to simply sit on the sidelines or be overly bearish.
As always, we are happy to not only do calls and meetings to discuss the performance and outlook for the Overlay, but we are also happy to serve as a resource for general questions on market volatility.
We appreciate your continued support and interest.

Shawn Gibson, Founding Member
Adam Stewart, CFA, Portfolio Manager
Justin Boller, CFA, Portfolio Manager
OVERLAY SHARES ETFS DISCLOSURES
Performance of less than one year is cumulative. You cannot invest directly in an index.
Overlay Shares are bought and sold at market price (not NAV) and are not individually redeemed from the Fund. Total Returns are calculated using the daily 4:00pm EST net asset value (NAV). Market price returns reflect the midpoint of the bid/ask spread as of the close of trading on the exchange where Fund shares are listed. Market price returns do not represent the returns you would receive if you traded shares at other times.
For a prospectus or summary prospectus with this and other important information about the Fund, please visit the Documents section of this website or call (866) 704-OVLS. Read the prospectus carefully before investing.
Shareholder Services: 1-866-704-OVLS
Investment Professionals: 770-350-8700 or info@overlayshares.com
Distributed by Foreside Fund Services, LLC, which is not affiliated with the Adviser.
RISK FACTORS
The Fund invests in options that derive their performance from the performance of the S&P 500 Index. Selling (writing) and buying options are speculative activities and entail greater than ordinary investment risks. The Fund’s use of put options can lead to losses because of adverse movements in the price or value of the underlying asset, which may be magnified by certain features of the options. When selling a put option, the Fund will receive a premium; however, this premium may not be enough to offset a loss incurred by the Fund if the price of the underlying asset is below the strike price by an amount equal to or greater than the premium. Purchased put options may expire worthless and the Fund would lose the premium it paid for the option. The Fund may lose significantly more than the premiums it receives in highly volatile market conditions.
The Fund will invest in short term put options which are financial derivatives that give buyers the right, but not the obligation, to sell (put) an underlying asset at an agreed-upon price and date. The Fund’s use of options may reduce the Fund’s ability to profit from increases in the value of the underlying asset. The Fund could experience a loss or increased volatility if its derivatives do not perform as anticipated or are not correlated with the performance of their underlying asset or if the Fund is unable to purchase or liquidate a position.
The Fund was recently organized and has no operating history. As a result, investors have a limited track record on which to base their investment decision. Investments involve risk including the possible loss of principal.
S&P 500 Total Return Index - An index of 500 stocks chosen for market size, liquidity and industry grouping, among other factors. The S&P 500 is designed to be a leading indicator of U.S. equities and is meant to reflect the risk/return characteristics of large cap stocks. All cash distributions (e.g. dividends and income) are reinvested. Used as a proxy for "Stocks" above.
Barclay’s U.S. Aggregate Bond Index - A broad-based index of bond securities used to represent investment-grade bonds traded in the U.S. The index was formerly known as the “Lehman Aggregate Bond Index”. Used as a proxy for "Bonds" above.
CBOE Volatility Index ("VIX") - An index sponsored by the Chicago Board of Options Exchange (CBOE) that shows the market's expectation of 30-day volatility. It is constructed using the implied volatilities of various option expirations and various strike prices of S&P 500 index options.
Correlation (R2) - A statistical measure of how two financial instruments (e.g. securities, indices, etc.) move in relation to each other. A correlation of +1 implies that as one security moves, either up or down, the other security will move in lockstep, in the same direction. Alternatively, the closer correlation is to 0, the less the movements of two securities are related to one another.
Beta - A measure of the portfolio’s sensitivity to changes in the benchmark. A beta of 1 indicates the portfolio has historically moved with the benchmark. A portfolio beta greater than 1 indicates the portfolio has been more volatile than the benchmark and a portfolio beta less than one indicates the portfolio has been less volatile than the benchmark. Beta in this presentation is calculated using monthly historical returns.
Sharpe Ratio - A measure for calculating risk-adjusted return. The Sharpe ratio is the average return earned in excess of the risk-free rate per unit of volatility or total risk. Subtracting the risk-free rate from the mean return, the performance associated with risk-taking activities can be isolated. Sharpe ratio = (Mean portfolio return − Risk-free rate)/Standard deviation of portfolio return. For Sharpe Ratio calculations in this presentation, the “risk free rate” is represented by the annualized monthly returns of the 3 Month US T-Bill.
Max Drawdown - A measure of the largest single drop from peak to trough based on monthly portfolio returns
HFRX Absolute Return Index - A stock index designed to measure absolute returns. The absolute return index is actually a composite index made up of five other indexes. This index is used to compare the absolute returns posted by the hedge fund market as a whole against individual hedge funds.
Standard Deviation - A measure of the dispersion of a set of data from its mean.

QUARTERLY FUND REVIEW | As of December 31, 2023

QUARTERLY FUND REVIEW | As of September 30, 2023