By Shawn Gibson on Apr 23, 2024

FUND OVERVIEWS
The Overlay Shares suite of ETFs seeks to provide incremental yield on top of low-cost market beta ETFs by utilizing a highly risk-controlled put spread writing strategy ("the Overlay Strategy") on the S&P 500 Index. If successful, the ETFs have the ability to provide higher yield and higher total return than holding the underlying ETFs alone. The Overlay Strategy is applied and managed the same way in all seven of the Overlay Shares funds:
| FUND NAME | BETA EXPOSURE | INCEPTION DATE |
| Overlay Shares Large Cap Equity ETF (OVL) | US Large Cap Equity | 09/30/2019 |
| Overlay Shares Small Cap Equity ETF (OVS) | US Small Cap Equity | 09/30/2019 |
| Overlay Shares Foreign Equity ETF (OVF) | International Equity | 09/30/2019 |
| Overlay Shares Core Bond ETF (OVB) | Broad Investment Grade Bond | 09/30/2019 |
| Overlay Shares Municipal Bond ETF (OVM) | Municipal Bond | 09/30/2019 |
| Overlay Shares Short Term Bond ETF (OVT) | Short Term Corporate Bond | 01/14/2021 |
| Overlay Shares Hedged Large Cap Equity ETF (OVLH) | Hedged US Large Cap Equity | 01/14/2021 |
The Overlay Shares Hedged Large Cap ETF (OVLH) maintains laddered downside hedges to protect the portfolio against significant market drawdowns.
PERFORMANCE OVERVIEW
Despite increased uncertainty around the timing of interest rate cuts from the FOMC, the equity markets continued to tolerate the likelihood "higher for longer," with Large Cap equities leading the way in a very strong quarter. The S&P 500 Index gained 10.56% for the quarter, continuing the strong trend from 2023. Foreign stocks also logged a strong quarter with the MSCI ACWI ex US Index up 4.69%. Small Cap stocks underperformed, with the S&P 600 SmallCap Index up just 2.46%. Interest rates crept higher during the quarter, putting some pressure on the bond markets. The US Aggregate Bond Index finished the quarter down -0.78%. Short duration bonds fared better with the Bloomberg U.S. Corporate 1-5 Years Index up 0.60%.
The Overlay Shares were positively impacted by the gains in the Overlay, which added about 250 basis points in gross alpha for the quarter. This alpha allowed all seven of the Overlay Shares funds to finish positive for the quarter, with 6 of them beating their benchmarks by a wide margin. The Overlay Shares Hedged Large Cap (OVLH) continues to meet our expectations, providing investors with significant equity appreciation potential while mitigating downside risk. The risk mitigation for OVLH is designed to defend against market declines that cause significant impairment of capital. OVLH performed well within its peer group for the 1st quarter of the year.
FUND PERFORMANCE
| Q1 24 | YTD | 1 YEAR | 3 YEARS | Inception to Date | |
| OVL NAV Returns | 12.86% | 12.86% | 35.58% | 11.52% | 16.12% |
| OVL Market Price Returns | 13.17% | 13.17% | 34.07% | 11.59% | 16.19% |
| S&P 500 Total Return Index | 10.56% | 10.56% | 29.88% | 11.49% | 15.33% |
| Gross Expense Ratio | 0.87% |
| OVS NAV Returns | 4.72% | 4.72% | 19.24% | 2.29% | 10.54% |
| OVS Market Price Returns | 4.81% | 4.81% | 19.38% | 2.31% | 10.58% |
| S&P 600 Total Return Index | 2.46% | 2.46% | 15.93% | 2.28% | 9.81% |
| Gross Expense Ratio | 0.88% |
| OVF NAV Returns | 7.21% | 7.21% | 16.20% | 3.37% | 4.21% |
| OVF Market Price Returns | 7.28% | 7.28% | 16.41% | 3.48% | 4.23% |
| MSCI All Country World ex USA Index | 4.69% | 4.69% | 13.26% | 1.94% | 6.38% |
| Gross Expense Ratio | 0.98% |
| OVB NAV Returns | 1.59% | 1.59% | 4.78% | -2.10% | 0.20% |
| OVB Market Price Returns | 1.60% | 1.60% | 4.63% | -2.13% | 0.18% |
| Bloomberg US Aggregate Bond Index | -0.78% | -0.78% | 1.70% | -2.46% | -0.77% |
| Gross Expense Ratio | 0.87% |
| OVM NAV Returns | 1.94% | 1.94% | 5.84% | 0.14% | 1.94% |
| OVM Market Price Returns | 1.81% | 1.81% | 5.96% | 0.19% | 1.98% |
| Bloomberg Municipal Bond Index | -0.39% | -0.39% | 3.13% | -0.41% | 0.94% |
| Gross Expense Ratio | 0.88% |
| OVT NAV Returns | 2.83% | 2.83% | 8.19% | 0.68% | 0.65% |
| OVT Market Price Returns | 2.63% | 2.63% | 8.12% | 0.64% | 0.62% |
| Bloomberg US Corporate 1-5 Years TR Index | 0.60% | 0.60% | 5.07% | 0.32% | 0.15% |
| Gross Expense Ratio | 0.85% |
| OVLH NAV Returns | 8.14% | 8.14% | 21.44% | 7.34% | 7.90% |
| OVLH Market Price Returns | 8.11% | 8.11% | 21.77% | 7.32% | 7.88% |
| S&P 500 Total Return Index | 10.56% | 10.56% | 29.88% | 11.49% | 12.41% |
| Gross Expense Ratio | 0.93% |
Source: U.S. Bank & Liquid Strategies.
*Inception for OVL, OVS, OVF, OVB, OVM is 09/30/2019. Inception for OVLH and OVT is 01/14/2021.
Performance data quoted represents past performance and is no guarantee of future results. Investment return and principal value of an investment will fluctuate so that an investor's shares, when redeemed, may be worth more or less than their original cost. Current performance may be lower or higher than the performance data quoted. For the most recent month-end performance, please call 1-866-704-OVLS.
Overlay Shares are bought and sold at market price (not NAV) and are not individually redeemed from the Fund. Total Returns are calculated using the daily 4:00pm EST net asset value (NAV). Market price returns reflect the midpoint of the bid/ask spread as of the close of trading on the exchange where Fund shares are listed. Market price returns do not represent the returns you would receive if you traded shares at other times.
MARKET OVERVIEW
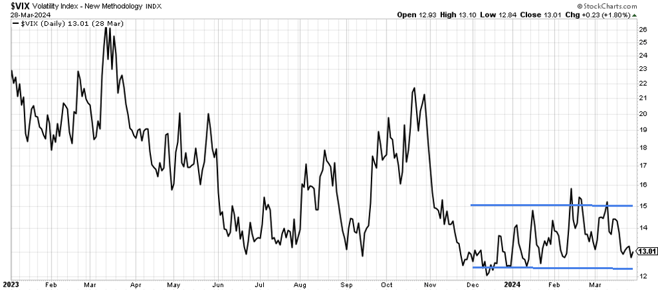
The market environment in the 1st quarter was ideal for our alpha source (the Overlay). While the Strategy does not depend on rising equity markets to generate returns, the grinding higher market kept volatility extremely compressed and resulted in any dips in the market being short-lived and shallow. This resulted in a high success rate in the Overlay positions. The Overlay has now generated about 411 bps of gross alpha over the past 12 months.
As the chart below illustrates, volatility (as measured by the CBOE Volatility Index or “the VIX”) remained rangebound at levels well below long-term averages. This not only indicates that the equity markets were very quiet, but also that market participants have very little concern about a risk-off event in the coming months.
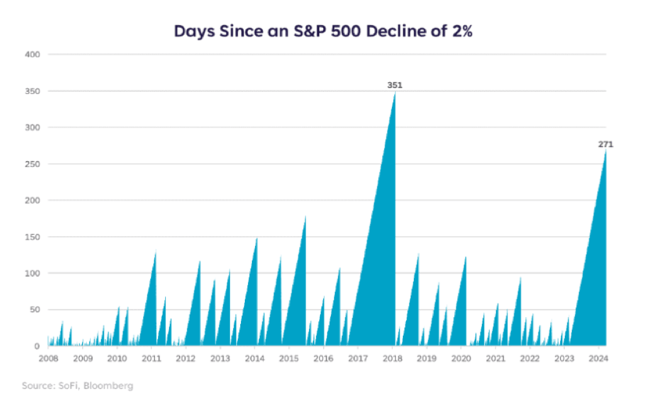
The reason why many market participants are not concerned about a significant pullback is they have become so conditioned to brief, shallow pullbacks. The following charts hit this point home, showing that we have now gone the second most days without a 2% down day since the Great Financial Crisis.
One factor that helped dampen vol in Q1 was more upside participation from other sectors beyond mega tech. The following chart illustrates this as Energy, Utilities, Materials, and Financials were the top performers for March, making up for the underperformance of tech.
Market Breath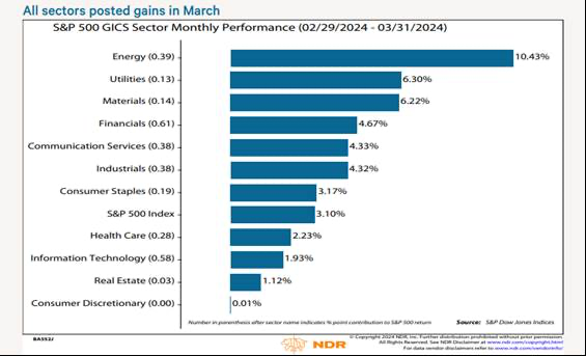
While we continue to be very constructive about the environment for the Overlay strategy, there are risks to the overall market outlook:
- Sticky inflation could cause rates to stay higher for longer. This could be especially problematic for small cap stocks that carry higher debt loads that will need to be refinanced at higher rates.
- Higher rates could start to take a material toll on the economy, which has been very resilient so far. The positive view on this is that we could return to the old days of the “Fed put” where the FOMC could quickly ease monetary policy if necessary. Accelerated rate cuts would likely be very well received by the markets, at least in the short term.
- Stress in the banking sector relating to commercial loans on near vacant properties could accelerate and broaden.
- Several geopolitical risks could surface that could spark a broad derisking in the markets.
As mentioned in previous letters, equity volatility appears to have moved into a low/normal volatility regime that typically lasts 3-5 years. While these types of volatility regimes can have occasional flare-ups in short-term volatility, they tend to come with quiet markets with relatively modest pullbacks and attractive volatility risk premiums (a cornerstone for the success of the Overlay). This type of environment can be very attractive for the Overlay strategy given our approach to option writing and risk management. With that said, market dynamics can change quickly, so we will continue to manage the strategy in a conservative and highly risk-controlled manner.
As always, we are happy to not only do calls and meetings to discuss the performance and outlook for the Overlay, but we are also happy to serve as a resource for general questions on market volatility.
We appreciate your continued support and interest.

Shawn Gibson, Founding Member
Adam Stewart, CFA, Portfolio Manager
OVERLAY SHARES ETFS DISCLOSURES
Performance of less than one year is cumulative. You cannot invest directly in an index.
Overlay Shares are bought and sold at market price (not NAV) and are not individually redeemed from the Fund. Total Returns are calculated using the daily 4:00pm EST net asset value (NAV). Market price returns reflect the midpoint of the bid/ask spread as of the close of trading on the exchange where Fund shares are listed. Market price returns do not represent the returns you would receive if you traded shares at other times.
Investors should consider the investment objectives, risks, charges and expenses carefully before investing. For a prospectus or summary prospectus with this and other important information about the Fund, please visit the Documents section of this website or call (866) 704-OVLS. Read the prospectus carefully before investing.
Shareholder Services: 1-866-704-OVLS
Investment Professionals: 770-350-8700 or info@overlayshares.com
Distributed by Foreside Fund Services, LLC, which is not affiliated with the Adviser.
RISK FACTORS
The Funds invest in options that derive their performance from the performance of the S&P 500 Index. Selling (writing) and buying options are speculative activities and entail greater than ordinary investment risks. The Funds' use of put options can lead to losses because of adverse movements in the price or value of the underlying asset, which may be magnified by certain features of the options. When selling a put option, the Funds will receive a premium; however, this premium may not be enough to offset a loss incurred by the Funds if the price of the underlying asset is below the strike price by an amount equal to or greater than the premium. Purchased put options may expire worthless and the Funds would lose the premiums paid for the options. The Funds may lose significantly more than the premiums they receive in highly volatile market conditions.
The Funds will invest in short term put options which are financial derivatives that give buyers the right, but not the obligation, to sell (put) an underlying asset at an agreed-upon price and date. The Funds' use of options may reduce the Funds' ability to profit from increases in the value of the underlying asset. The Funds could experience a loss or increased volatility if the derivatives do not perform as anticipated or are not correlated with the performance of their underlying asset or if the Funds are unable to purchase or liquidate a position.
The Funds were recently organized and have no operating history. As a result, investors have a limited track record on which to base their investment decision. Investments involve risk including the possible loss of principal.
S&P 500 Total Return Index - An index of 500 stocks chosen for market size, liquidity and industry grouping, among other factors. The S&P 500 is designed to be a leading indicator of U.S. equities and is meant to reflect the risk/return characteristics of large cap stocks. All cash distributions (e.g. dividends and income) are reinvested. Used as a proxy for "Stocks" above.
Barclay’s U.S. Aggregate Bond Index - A broad-based index of bond securities used to represent investment-grade bonds traded in the U.S. The index was formerly known as the “Lehman Aggregate Bond Index”. Used as a proxy for "Bonds" above.
CBOE Volatility Index ("VIX") - An index sponsored by the Chicago Board of Options Exchange (CBOE) that shows the market's expectation of 30-day volatility. It is constructed using the implied volatilities of various option expirations and various strike prices of S&P 500 index options.
Correlation (R2) - A statistical measure of how two financial instruments (e.g. securities, indices, etc.) move in relation to each other. A correlation of +1 implies that as one security moves, either up or down, the other security will move in lockstep, in the same direction. Alternatively, the closer correlation is to 0, the less the movements of two securities are related to one another.
Beta - A measure of the portfolio’s sensitivity to changes in the benchmark. A beta of 1 indicates the portfolio has historically moved with the benchmark. A portfolio beta greater than 1 indicates the portfolio has been more volatile than the benchmark and a portfolio beta less than one indicates the portfolio has been less volatile than the benchmark. Beta in this presentation is calculated using monthly historical returns.
Sharpe Ratio - A measure for calculating risk-adjusted return. The Sharpe ratio is the average return earned in excess of the risk-free rate per unit of volatility or total risk. Subtracting the risk-free rate from the mean return, the performance associated with risk-taking activities can be isolated. Sharpe ratio = (Mean portfolio return − Risk-free rate)/Standard deviation of portfolio return. For Sharpe Ratio calculations in this presentation, the “risk free rate” is represented by the annualized monthly returns of the 3 Month US T-Bill.
Max Drawdown - A measure of the largest single drop from peak to trough based on monthly portfolio returns
HFRX Absolute Return Index - A stock index designed to measure absolute returns. The absolute return index is actually a composite index made up of five other indexes. This index is used to compare the absolute returns posted by the hedge fund market as a whole against individual hedge funds.
Standard Deviation - A measure of the dispersion of a set of data from its mean.
Bloomberg US Corporate 1-5 Years TR Index - The Bloomberg US Corporate Bond 1-5 Year Index measures the investment grade, fixed-rate, taxable corporate bond market with 1-5 year maturities.
Bloomberg Municipal Bond Index - The Bloomberg Municipal Index measures the performance of the Bloomberg U.S. Municipal bond market, which covers the USD- denominated Long-Term tax-exempt bond market with four main sectors: state and local general obligation bonds, revenue bonds, insured bonds, and pre-refunded bonds.
Bloomberg US Aggregate Bond Index - The Bloomberg US Aggregate Bond Index is a broad-based flagship benchmark that measures the investment grade, US dollardenominated, fixed-rate taxable bond market. The index includes Treasuries, government-related and corporate securities, fixed rate agency MBS, ABS and CMBS (agency and non-agency).
MSCI All Country World ex USA Index - The MSCI ACWI ex USA Index captures large and mid cap representation across 22 of 23 Developed Markets (DM) countries (excluding the US) and 24 Emerging Markets (EM) countries*.
S&P 600 Total Return Index - The S&P SmallCap 600® seeks to measure the small-cap segment of the U.S. equity market. The index is designed to track companies that meet specific inclusion criteria to ensure that they are liquid and financially viable.
Alpha - The excess return of an investment relative to the return of a benchmark index. Alpha may be positive or negative and is the result of active investing.
Basis point - A basis point is a common unit of measure for interest rates and other percentages in finance. One basis point is equal to 1/100th of 1%, or 0.01%. In decimal form, one basis point appears as 0.0001 (0.01/100). Basis points (BPS) are used to show the change in the value or rate of a financial instrument, such as 1% change equals a change of 100 basis points and 0.01% change equals one basis point.

QUARTERLY FUND REVIEW | As of June 30, 2024
QUARTERLY FUND REVIEW | As of March 31, 2025
.png)