By Shawn Gibson on Oct 26, 2023

FUND OVERVIEWS
The Overlay Shares suite of ETFs seeks to provide incremental yield on top of low-cost market beta ETFs by utilizing a highly risk-controlled put spread writing strategy ("the Overlay Strategy") on the S&P 500 Index. If successful, the ETFs have the ability to provide higher yield and higher total return than holding the underlying ETFs alone. The Overlay Strategy is applied and managed the same way in all seven of the Overlay Shares funds:
| FUND NAME | BETA EXPOSURE | INCEPTION DATE | GROSS EXPENSE RATIO |
| Overlay Shares Large Cap Equity ETF (OVL) | US Large Cap Equity | 09/30/2019 | 0.80% |
| Overlay Shares Small Cap Equity ETF (OVS) | US Small Cap Equity | 09/30/2019 | 0.84% |
| Overlay Shares Foreign Equity ETF (OVF) | International Equity | 09/30/2019 | 0.99% |
| Overlay Shares Core Bond ETF (OVB) | Broad Investment Grade Bond | 09/30/2019 | 0.80% |
| Overlay Shares Municipal Bond ETF (OVM) | Municipal Bond | 09/30/2019 | 0.84% |
| Overlay Shares Short Term Bond ETF (OVT) | Short Term Corporate Bond | 01/14/2021 | 0.81% |
| Overlay Shares Hedged Large Cap Equity ETF (OVLH) | Hedged US Large Cap Equity | 01/14/2021 | 0.88% |
In addition to generating income through the Overlay Strategy, the Overlay Shares Hedged Large Cap ETF (OVLH) maintains laddered downside hedges to protect the portfolio against significant market drawdowns.
PERFORMANCE OVERVIEW
Renewed concerns around the possibility of "higher for longer" FOMC interest rate policy led to a simultaneous pullback in equities and bonds in the 3rd quarter of 2023. The S&P 500 Index lost 3.27% for the quarter, bringing the YTD return to +13.07%. Small Cap and International stocks continued to underperform U.S. large cap stocks as investors showed a preference for high quality US-based companies. With the exception of short duration bonds, the fixed income markets experienced heavy selling as interest rates spiked. The US Aggregate Bond Index fell 3.23% for the quarter, leaving the index in negative territory YTD at -1.21%.
The Overlay Shares were not only negatively impacted by the losses in the various asset class betas, but the Overlay hindered performance even further with a loss of 0.93% on a gross basis for the quarter, bringing the YTD gross return to 0.97%. As the table below shows, the Overlay Shares Large Cap ETF (OVL), Overlay Shares Large Cap ETF (OVB), and Overlay Shares Large Cap ETF (OVM) have outperformed their benchmarks since inception despite a poor environment for the Overlay Strategy in 2022. The Overlay Shares Hedged Large Cap (OVLH) continues to meet our expectations, providing investors with significant equity appreciation potential while mitigating downside risk. The risk mitigation for OVLH is designed to defend against market declines that cause significant impairment of capital. By the end of the quarter, the hedges in OVLH were beginning to reach the point of providing material protection, allowing investors to have greater comfort to remain invested in equities moving into the 4th quarter.
FUND PERFORMANCE
| Q3 23 | YTD | 1 YEAR | 3 YEARS | Inception to Date | |
| OVL NAV Returns | -4.33% | 13.37% | 23.11% | 9.72% | 11.39% |
| OVL Market Price Returns | -4.54% | 13.41% | 22.81% | 9.56% | 11.37% |
| S&P 500 Total Return Index | -3.27% | 13.07% | 21.62% | 10.15% | 11.38% |
| OVS NAV Returns | -6.04% | 1.05% | 11.25% | 11.50% | 6.59% |
| OVS Market Price Returns | -6.21% | 0.87% | 11.18% | 11.45% | 6.58% |
| S&P 600 Total Return Index | -6.21% | 0.81% | 10.08% | 12.10% | 6.61% |
| OVF NAV Returns | -5.33% | 3.79% | 17.76% | 0.76% | 0.20% |
| OVF Market Price Returns | -5.41% | 3.31% | 17.99% | 0.76% | 0.16% |
| MSCI All Country World ex USA Index | -3.77% | 5.34% | 20.39% | 3.74% | 3.55% |
| OVB NAV Returns | -4.34% | -0.73% | 1.95% | -5.37% | -2.04% |
| OVB Market Price Returns | -4.03% | -0.70% | 2.16% | -5.35% | -2.02% |
| Bloomberg US Aggregate Bond Index | -3.23% | -1.21% | 0.64% | -5.21% | -2.30% |
| OVM NAV Returns | -4.38% | -0.71% | 3.97% | -2.09% | -0.22% |
| OVM Market Price Returns | -4.42% | -0.82% | 4.05% | -2.13% | -0.22% |
| Bloomberg Municipal Bond Index | -3.95% | -1.38% | 2.66% | -2.30% | -0.74% |
| OVT NAV Returns | -1.01% | 2.27% | 5.48% | N/A | -2.15% |
| OVT Market Price Returns | -1.04% | 2.20% | 5.47% | N/A | -2.15% |
| Bloomberg US Corporate 1-5 Years TR Index | 0.25% | 2.01% | 4.00% | N/A | -1.52% |
| OVLH NAV Returns | -3.54% | 7.67% | 11.76% | N/A | 3.04% |
| OVLH Market Price Returns | -3.73% | 7.50% | 11.51% | N/A | 3.04% |
| S&P 500 Total Return Index | -3.27% | 13.07% | 21.62% | N/A | 6.25% |
*Inception for OVL, OVS, OVF, OVB, OVM is 09/30/2019. Inception for OVLH and OVT is 01/14/2021.
Performance data quoted represents past performance and is no guarantee of future results. Investment return and principal value of an investment will fluctuate so that an investor's shares, when redeemed, may be worth more or less than their original cost. Current performance may be lower or higher than the performance data quoted. For the most recent month-end performance, please call 1-866-704-OVLS.
Overlay Shares are bought and sold at market price (not NAV) and are not individually redeemed from the Fund. Total Returns are calculated using the daily 4:00pm EST net asset value (NAV). Market price returns reflect the midpoint of the bid/ask spread as of the close of trading on the exchange where Fund shares are listed. Market price returns do not represent the returns you would receive if you traded shares at other times.
MARKET OVERVIEW
The 3rd quarter got off to a positive start for the equity markets with the S&P 500 Index up 3.21% for the month of July along with the S&P SmallCap 600 Index up 5.51%. However, as the calendar flipped to August, inflation concerns (and therefore concerns of interest rates being higher for longer) fueled a sharp move higher in interest rates and a boost in volatility across all risk assets.
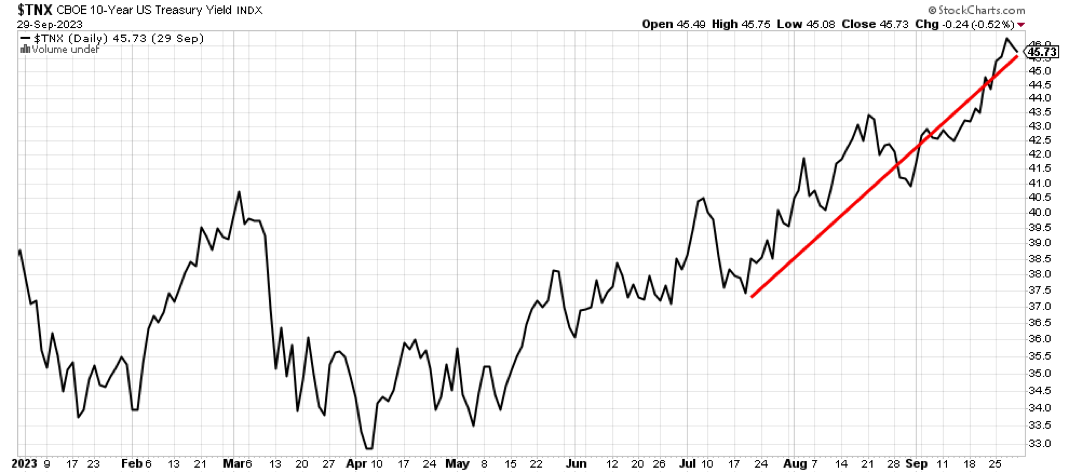
The 10-year Treasury yield spiked from a July low of about 3.75% to nearly 4.6% by the end of a quarter, continuing a move higher from the 3.3% level of early April. This move put significant pressure on longer term bonds, leading to a -3.23% loss for the Bloomberg US Aggregate Bond Index. The most interest rate sensitive bonds (longer term zero coupon) had a devastating quarter as evidenced by the ICE BofAML Long US Treasury STRIPS Index. The index was -20.14% for the quarter and is off nearly 58% from its 2020 highs. Short-duration bonds fared much better with the Bloomberg US Corporate 1-5 Year Index actually gaining 0.25% for the quarter.
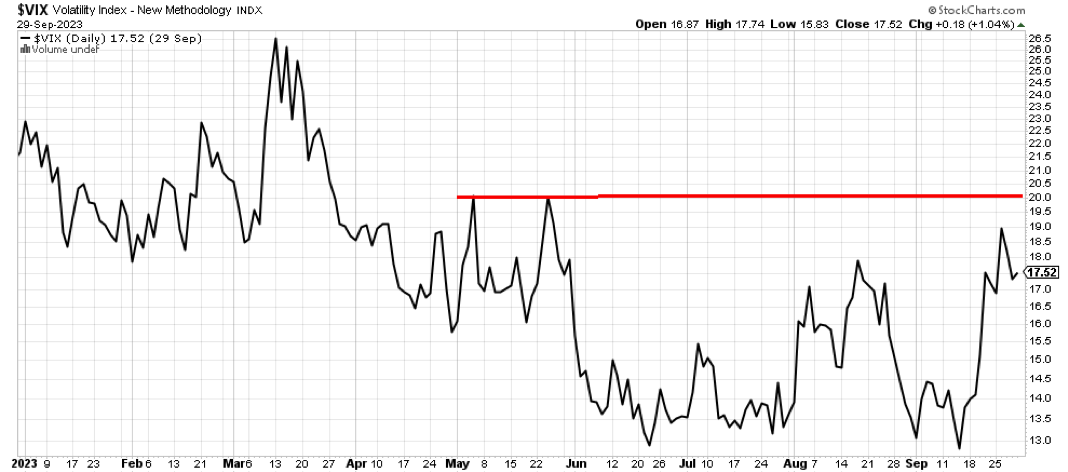
This heightened interest rate volatility spilled over into the equity markets with the CBOE S&P 500 Volatility Index (the "VIX") jumping from a level of around 13 up to a September peak of around 19. However, there is a silver lining in this jump in volatility. Despite a 7% pullback in the S&P 500 Index on an intra-day basis, the VIX never moved above 20 which is the long-term average for the index. So, while the market felt unstable at times, equities actually remained at below-average volatility levels during the quarter. This is indicative up a very orderly pullback in a market that had gotten very overbought and had overly positive sentiment moving into the start of Q3.
As mentioned in previous letters, equity volatility appears to have moved into a low/normal volatility regime that typically lasts 3-5 years. While these type of volatility regimes can have occasional flare ups in short-term volatility, they tend to come with quiet markets with relatively modest pullbacks and attractive volatility risk premiums (a cornerstone for the success of the Overlay). This type of environment can be very attractive for the Overlay strategy given our approach to option writing and risk management. From a seasonality perspective, the 4th quarter tends to be supportive for equities and the valuation adjustments seen in the 3rd quarter could further support a stabilization of risk assets going into the end of the year. As such, the high probability outcomes for the Overlay are expected to continue in the final quarter and beyond. With that said, market dynamics can change quickly, so we will continue to manage the strategy in a conservative and highly risk-controlled manner.
As always, we are happy to not only do calls and meetings to discuss the performance and outlook for the Overlay, but we are also happy to serve as a resource for general questions on market volatility.
We appreciate your continued support and interest.

Shawn Gibson, Founding Member
Adam Stewart, CFA, Portfolio Manager
Justin Boller, CFA, Portfolio Manager
OVERLAY SHARES ETFS DISCLOSURES
Performance of less than one year is cumulative. You cannot invest directly in an index.
Overlay Shares are bought and sold at market price (not NAV) and are not individually redeemed from the Fund. Total Returns are calculated using the daily 4:00pm EST net asset value (NAV). Market price returns reflect the midpoint of the bid/ask spread as of the close of trading on the exchange where Fund shares are listed. Market price returns do not represent the returns you would receive if you traded shares at other times.
For a prospectus or summary prospectus with this and other important information about the Fund, please visit the Documents section of this website or call (866) 704-OVLS. Read the prospectus carefully before investing.
Shareholder Services: 1-866-704-OVLS
Investment Professionals: 770-350-8700 or info@overlayshares.com
Distributed by Foreside Fund Services, LLC, which is not affiliated with the Adviser.
RISK FACTORS
The Fund invests in options that derive their performance from the performance of the S&P 500 Index. Selling (writing) and buying options are speculative activities and entail greater than ordinary investment risks. The Fund’s use of put options can lead to losses because of adverse movements in the price or value of the underlying asset, which may be magnified by certain features of the options. When selling a put option, the Fund will receive a premium; however, this premium may not be enough to offset a loss incurred by the Fund if the price of the underlying asset is below the strike price by an amount equal to or greater than the premium. Purchased put options may expire worthless and the Fund would lose the premium it paid for the option. The Fund may lose significantly more than the premiums it receives in highly volatile market conditions.
The Fund will invest in short term put options which are financial derivatives that give buyers the right, but not the obligation, to sell (put) an underlying asset at an agreed-upon price and date. The Fund’s use of options may reduce the Fund’s ability to profit from increases in the value of the underlying asset. The Fund could experience a loss or increased volatility if its derivatives do not perform as anticipated or are not correlated with the performance of their underlying asset or if the Fund is unable to purchase or liquidate a position.
The Fund was recently organized and has no operating history. As a result, investors have a limited track record on which to base their investment decision. Investments involve risk including the possible loss of principal.
S&P 500 Total Return Index - An index of 500 stocks chosen for market size, liquidity and industry grouping, among other factors. The S&P 500 is designed to be a leading indicator of U.S. equities and is meant to reflect the risk/return characteristics of large cap stocks. All cash distributions (e.g. dividends and income) are reinvested. Used as a proxy for "Stocks" above.
Barclay’s U.S. Aggregate Bond Index - A broad-based index of bond securities used to represent investment-grade bonds traded in the U.S. The index was formerly known as the “Lehman Aggregate Bond Index”. Used as a proxy for "Bonds" above.
CBOE Volatility Index ("VIX") - An index sponsored by the Chicago Board of Options Exchange (CBOE) that shows the market's expectation of 30-day volatility. It is constructed using the implied volatilities of various option expirations and various strike prices of S&P 500 index options.
Correlation (R2) - A statistical measure of how two financial instruments (e.g. securities, indices, etc.) move in relation to each other. A correlation of +1 implies that as one security moves, either up or down, the other security will move in lockstep, in the same direction. Alternatively, the closer correlation is to 0, the less the movements of two securities are related to one another.
Beta - A measure of the portfolio’s sensitivity to changes in the benchmark. A beta of 1 indicates the portfolio has historically moved with the benchmark. A portfolio beta greater than 1 indicates the portfolio has been more volatile than the benchmark and a portfolio beta less than one indicates the portfolio has been less volatile than the benchmark. Beta in this presentation is calculated using monthly historical returns.
Sharpe Ratio - A measure for calculating risk-adjusted return. The Sharpe ratio is the average return earned in excess of the risk-free rate per unit of volatility or total risk. Subtracting the risk-free rate from the mean return, the performance associated with risk-taking activities can be isolated. Sharpe ratio = (Mean portfolio return − Risk-free rate)/Standard deviation of portfolio return. For Sharpe Ratio calculations in this presentation, the “risk free rate” is represented by the annualized monthly returns of the 3 Month US T-Bill.
Max Drawdown - A measure of the largest single drop from peak to trough based on monthly portfolio returns
HFRX Absolute Return Index - A stock index designed to measure absolute returns. The absolute return index is actually a composite index made up of five other indexes. This index is used to compare the absolute returns posted by the hedge fund market as a whole against individual hedge funds.
Standard Deviation - A measure of the dispersion of a set of data from its mean.

QUARTERLY FUND REVIEW | As of December 31, 2023

QUARTERLY FUND REVIEW | As of September 30, 2025