Manager Commentary: Q1 2023
By Shawn Gibson on Apr 25, 2023

Despite a near 10% drawdown in the S&P 500 Index, and a short but volatility-inducing banking crisis, most risk assets delivered positive performance in the 1st Quarter with the S&P 500 Index gained 7.50%, Small Cap Equities up 2.57%, Non-US equities jumping 6.87% and core bonds increasing by 2.96%. The more supportive environment continued for the Overlay strategy, gaining 0.78% gross for the quarter. This positive contribution has resulted in YTD outperformance in the separate account strategies and the funds.
ANNUALIZED SEPARATE ACCOUNT ILLUSTRATIVE RETURNS (Net1)
11/01/2013 - 03/31/2023
| Q1 | 1 YEARS | 3 YEARS | 5 YEARS | Inception to Date | |
| Large Cap Equity Strategy | 8.04% | -10.84% | 19.19% | 10.80% | 12.92% |
| S&P 500 Index | 7.48% | -7.76% | 18.58% | 11.17% | 11.55% |
| Small Cap Equity Strategy | 3.11% | -11.90% | 22.35% | 5.87% | 9.75% |
| S&P 600 Index | 2.57% | -8.82% | 21.71% | 6.30% | 8.46% |
| Foreign Equity Strategy | 6.59% | -6.44% | 6.93% | 1.00% | 5.06% |
| MSCI ACWI ex US MinVol | 6.87% | -5.07% | 11.80% | 2.47% | 3.32% |
| Core Bond Strategy | 3.80% | -7.34% | -1.91% | 0.95% | 3.12% |
| Bbg Barc US Aggregate Index | 2.96% | -4.78% | -2.77% | 0.91% | 1.56% |
| Short Term Bond Strategy | 2.41% | -2.93% | 1.73% | 1.88% | 3.32% |
| Bbg Barc US Corp 1-5 Yr TR | 1.68% | -0.32% | 0.97% | 1.85% | 1.83% |
| Municipal Bond Strategy | 3.12% | -2.31% | 1.33% | 5% | 3.97% |
| Bbg Barc Muni Bond Index | 4.10% | -8.53% | -0.77% | 1.25% | 2.57% |
1Net of fees assumes a 0.75% management fee applied monthly. The three, five and ITD are shown annualized. These returns are illustrative, hypothetical numbers representative of two actual return streams (Liquid Strategies Overlay and the underlying index ETF). The numbers illustrate what would have happened had we taken the underlying index ETF returns and added Liquid Strategy Overlay returns to them. Source: Morningstar, Liquid Strategies.
HEDGED LARGE CAP EQUITY SINCE INCEPTION ILLUSTRATIVE RETURNS (Net1)
06/30/2019 - 03/31/2023
| Inception to Date | |
| Annualized Return (Net) | 8.38% |
| Annualized Volatility | 12.07% |
| Sharpe Ratio | 0.62 |
| Max Drawdown | -19.25% |
| Beta vs S&P 500 | 0.59 |
| Up Capture | 65.90% |
| Down Capture | 62.53% |
OVERLAY STRATEGY ANNUALIZED PERFORMANCE
11/01/2013 - 03/31/2023
| Q1 | 1 YEARS | 3 YEARS | 5 YEARS | Inception to Date | |
| Overlay Strategy (Gross) | 0.78% | -1.85% | 1.74% | 0.88% | 2.36% |
| Overlay Strategy (Net) | 0.59% | -2.59% | 0.98% | 0.12% | 1.60% |
Net of fees assumes a 0.75% annual management fee.
*Hypothetical/Illustrative performance is not an indicator of future actual results. The results reflect performance of a strategy not offered to investors during the time indicated in the analysis and do not represent returns that any investor actually attained. Hypothetical/Illustrative results are calculated by the retroactive application of the Overlay strategy constructed on the basis of historical data combined with other existing independently-managed ETFs and based on assumptions integral to this presentation which may or may not be testable and are subject to losses. General assumptions include: The manager would have been able to purchase securities in a single portfolio with similar characteristics to the Overlay Strategy and the Index ETFs recommended by the illustration, and the markets were sufficiently liquid to permit all trading. Indexes used for comparative purposes cannot be traded, however there are securities, funds, and similar investments that can be purchased to obtain similar results and include no fees. Changes in these assumptions may have a material impact on the hypothetical returns presented. No representations and warranties are made as to the reasonableness of the assumptions. This information is provided for illustrative purposes only. Actual performance may differ significantly from hypothetical/illustrative performance. Source: Morningstar, Bloomberg, L.P., Liquid Strategies.
The Overlay strategy is not dependent on a rising equity market for positive returns, as it has the ability to generate positive performance in flat and modestly lower markets. Of greater importance is having confidence that the options market is properly pricing in market risk and uncertainty. When a stressful period starts (such as the beginning of 2022), the level of market uncertainty accelerates higher and the potential range of outcomes starts to widen. This uncertainty and range of outcomes continues to increase as market participants continue to recalibrate pricing in risk assets and react decisively to new information. It is during this part of the cycle where the options market is also recalibrating risk and the probability of making positive returns selling options goes down. This phase of the cycle lasted the first 9 months of 2022, which is where the Overlay incurred most of its underperformance. It was during this time that the Strategy was managed in a manner that was even more conservative than how it is usually executed. In short, the Strategy was managed with a much lower value at risk the majority of the time.
Starting in October of 2022, this dynamic began to rapidly shift. Despite continued negative new headlines, the reaction to these headlines started to become much more muted, and in fact, would actually have some days that the market would be up in the face of news that would have crushed it earlier in the year. At the same time, options pricing stabilized tremendously and the expectations of future volatility pricing into these options dropped to levels well below that during the first 9 months. This shift gave us much greater confidence that we could expect a more consistent volatility risk premium (where we are being properly compensated for taking risk). It was at this time (late September/early October), that we began to normalize our positioning to help take advantage of a more constructive environment.
This shift to normalization in the options market has continued through the 1st quarter of 2023. The markets were presented with plenty of bad news headlines during the quarter that would have sparked new rounds of major volatility in early 2022, but in this quarter only triggered a moderate increase in volatility. There is no better example of this than the banking crisis that occurred in early March. After the news on Silicon Valley Bank, the S&P 500 Index made a quick 6% move lower over the course of just a few days, and then it was over. The markets recovered, volatility stabilized and the options market returned to being more efficiently priced. These type of surprise catalyst-driven market events tend to be short-lived unless there truly is more systemic risk, which is why we were comfortable continuing to run our strategy with normal risk parameters during and after those few days.
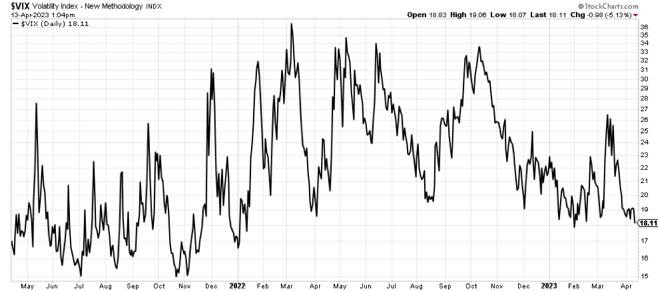
Volatility expectations quickly spiked in Q1, but remained well below 2022 peak levels:

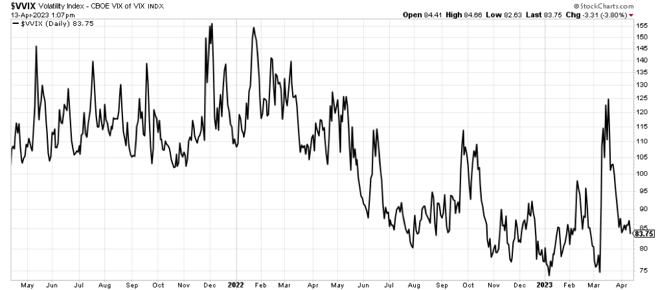
The rate of change of these volatility expectations also spiked, but then quickly normalized.

Historically, the opportunity set for the Overlay strategy has been very attractive after major market pullbacks for multiple years. The beginning of this positive cycle (which we hope started in October) typically coincides with a high level of market fear and bearish sentiment, as bear markets end with a climb up a wall of worry. Over time, investor confidence recovers and the equity markets return to a more traditional pattern. We are cautiously optimistic that we are close to that part of the cycle and the opportunity set that comes with it.
As always, we are happy to not only do calls and meetings to discuss the performance and outlook for the Overlay, but we are also happy to serve as a resource for general questions on market volatility.
We appreciate your continued support and interest.

Shawn Gibson, Founding Member
Adam Stewart, CFA, Portfolio Manager
Justin Boller, CFA, Portfolio Manager
The assertions and statements in this blog post are based on the opinions of the author and Liquid Strategies. The examples cited in this paper are based on hypothetical situations and should only be considered as examples of potential trading strategies. They do not take into consideration the impact that certain economic or market factors have on the decision making process. Past performance is no indication of future results. Inherent in any investment is the potential for loss.
- January 2026 (4)
- October 2025 (3)
- August 2025 (1)
- July 2025 (3)
- May 2025 (1)
- April 2025 (7)
- March 2025 (2)
- February 2025 (1)
- January 2025 (1)
- November 2024 (1)
- October 2024 (1)
- July 2024 (2)
- April 2024 (1)
- January 2024 (1)
- November 2023 (1)
- October 2023 (1)
- August 2023 (1)
- July 2023 (1)
- April 2023 (1)
- January 2023 (1)
- November 2022 (1)
- October 2022 (2)
- July 2022 (1)
- April 2022 (1)
- March 2022 (2)
- February 2022 (3)
- January 2022 (3)
- November 2021 (1)
- October 2021 (3)
- September 2021 (1)
- July 2021 (1)
- May 2021 (1)
- April 2021 (1)
- March 2021 (3)
- January 2021 (3)
- December 2020 (3)
- October 2020 (3)
- September 2020 (2)
- August 2020 (4)
- July 2020 (6)
- June 2020 (4)
- May 2020 (4)
- April 2020 (4)
- March 2020 (14)
- February 2020 (9)
- January 2020 (3)
- December 2019 (1)
- November 2019 (1)
- October 2019 (1)
- July 2019 (1)
- April 2019 (1)
Subscribe
You May Also Like
These Related Posts

Manager Commentary: Q2 2020

Manager Commentary: Q3 2020

