By Shawn Gibson on Oct 15, 2020

At the start of the quarter, the U.S. equity markets staged yet another dramatic rally, sending most global equity markets higher and pushing the S&P 500 Index to new all-time highs. Concerns around COVID, stimulus and elections led to an extremely volatile finish to the quarter in risk assets. Despite the volatile finish to the quarter, our income-based Overlay Strategy generated gross income of 1.42% for the quarter, bringing the annualized gross income produced by the Strategy to 2.94% since inception in 2013.
| Overlay Strategy Returns through 9/30/20 | |
| Q3 2020 | Annualized Since Inception (11/1/2013) |
| 1.42% (Gross) | 2.94% (Gross) |
| 1.24% (Net) | 2.17% (Net) |
Net of fees assumes a 0.75% management fee applied monthly.
The Strategy continues to demonstrate the ability to generate positive long-term incremental income to underlying beta sources in a variety of market conditions. For investors that would have been invested in these various strategies since the inception of the firm, below are the illustrative long-term performance results:
ANNUALIZED SEPARATE ACCOUNT ILLUSTRATIVE RETURNS (Net1)
11/01/2013 - 09/30/2020
| 1 YEARS | 3 YEARS | 5 YEARS | Inception to Date | |
| Large Cap Equity Strategy | 16.45% | 11.22% | 15.59% | 14.14% |
| S&P 500 Index | 15.15% | 12.28% | 14.15% | 12.11% |
| Small Cap Equity Strategy | -7.01% | -1.27% | 8.57% | 7.96% |
| S&P 600 Index | -8.32% | -0.33% | 7.20% | 6.04% |
| Foreign Equity Strategy | -1.46% | 0.93% | 6.65% | 6.14% |
| MSCI ACWI ex US | 3.00% | 1.16% | 6.23% | 2.68% |
| Core Bond Strategy | 7.40% | 8.60% | 4.68% | 5.82% |
| Bbg Barc US Agg Index | 6.98% | 5.24% | 4.18% | 3.90% |
| Municipal Bond Strategy | 5.62% | 3.45% | 5.24% | 6.15% |
| Bbg Barc Muni Bond Index | 4.09% | 4.28% | 3.84% | 4.25% |
1Net of fees assumes a 0.75% management fee applied monthly. These returns are illustrative, hypothetical numbers representative of two actual return streams (Liquid Strategies Overlay and the underlying index ETF). The numbers illustrate what would have happened had we taken the underlying index ETF returns and added Liquid Strategy Overlay returns to them. Source: Morningstar, Liquid Strategies.
OVERLAY STRATEGY ANNUALIZED PERFORMANCE
11/01/2013-09/30/2020
| 1 YEAR | 3 YEARS | 5 YEARS | Inception to Date | |
| Overlay Strategy (Gross) | 2.39% | 0.26% | 2.41% | 2.94% |
| Overlay Strategy (Net) | 1.63% | -0.48% | 1.65% | 2.17% |
Net of fees assumes a 0.75% management fee applied monthly.
*Hypothetical/Illustrative performance is not an indicator of future actual results. The results reflect performance of a strategy not offered to investors during the time indicated in the analysis and do not represent returns that any investor actually attained. Hypothetical/Illustrative results are calculated by the retroactive application of the Overlay strategy constructed on the basis of historical data combined with other existing independently-managed ETFs and based on assumptions integral to this presentation which may or may not be testable and are subject to losses. General assumptions include: The manager would have been able to purchase securities in a single portfolio with similar characteristics to the Overlay Strategy and the Index ETFs recommended by the illustration, and the markets were sufficiently liquid to permit all trading. Indexes used for comparative purposes cannot be traded, however there are securities, funds, and similar investments that can be purchased to obtain similar results and include no fees. Changes in these assumptions may have a material impact on the hypothetical returns presented. No representations and warranties are made as to the reasonableness of the assumptions. This information is provided for illustrative purposes only. Actual performance may differ significantly from hypothetical/illustrative performance. Source: Morningstar, Bloomberg, L.P., Liquid Strategies.
The end of the quarter also marks the end of the 1st year of the Overlay Shares suite of ETFs that were built to allow investors to access our separate account strategies while taking advantage of the benefits of investing in exchange-traded funds. While the returns of the underlying sources of beta for all of the strategies varied significantly across the five strategies, the income Overlay produced the same positive 2.39% gross incremental income for the past year despite one of the most challenging environments over the past three decades. For perspective, the following chart compares the return stream of the Overlay for the past year compared to an equal-weighted blend of five of the most common option writing indices:
Overlay Strategy vs Option Writing Indices
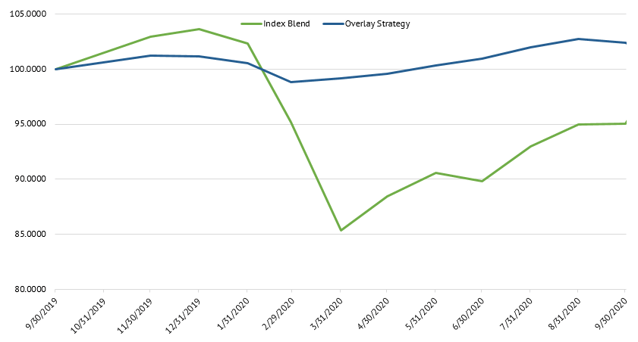
Index Blend: 20% CBOE S&P 500 Put Write Index (PUT)
20% CBOE S&P 500 Weekly Put Write Index (WPUT)
20% CBOE S&P 500 Buy Write Index (BXM)
20% CBOE S&P 500 Iron Condor Index (PUT)
20% CBOE S&P 500 Covered Combo Index (PUT)
As the chart illustrates, the Overlay strategy is much less sensitive to or reliant on equity market direction. This is a result of a combination of our conservative approach and our active risk management. In the nearly 7 years of managing the Overlay, our risk management process has been repeatedly tested and has consistently dampened volatility during periods of short-term market stress, with the latest successful test coming in September when the S&P 500 Index fell nearly 10% in the first two weeks of the month.
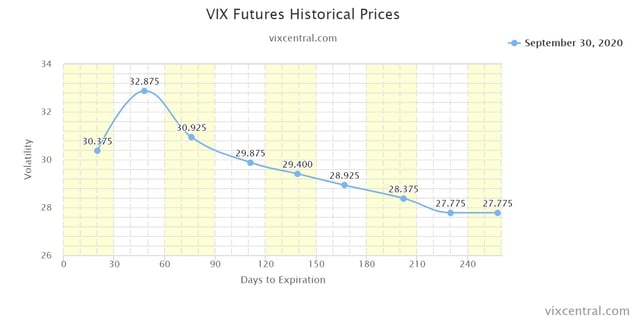
As we look forward, the final quarter of 2020 will likely be a fitting end to a chaotic year: more volatility. All eyes will be on the U.S. elections as the outcome could have a significant impact on future fiscal and monetary policy. It is appropriate for the market to price in greater uncertainty and volatility risk around the election, given not only the uncertainty of the results, but more importantly the uncertainty around the market reaction to the results. Rewinding to the previous election, the experts called for a Clinton victory and predicted that a Trump win would send the equity markets sharply lower. While the overnight reaction to the Trump election was sharply negative, it marked the beginning of another leg higher in the equity and bond markets. That election proved that it is extremely difficult to a) predict election outcomes; and b) predict the direction of the markets afterwards. The volatility markets are clearly pricing in risk around the election and through the remainder of the year, as evidenced by the futures curve for the CBOE Volatility Index (“VIX”). As of the end of the quarter, the market was still pricing in VIX levels of over 30 for the remainder of the year, well above the long-term average that is close to 20.
It is likely that the market is overpricing the future volatility as it typically does, but we do expect very high levels of volatility in the weeks leading up to and immediately after the election and then a stabilization and decline in volatility as we move closer to the holiday season. However, every trading day will come with potential for volatility flare ups given the high level of sensitivity to daily news (COVID numbers, high profile COVID cases, economic data, earnings data, China relations, etc.), not to mention the risks associated with a potential prolonged contested election.
One thing that is clear is that conservative yield has become very hard to find. With interest rates hovering near all-time lows, and with corporate bond spreads having tightened significantly, investors are being forced to take greater duration or default risk to generate yield. The suite of Overlay strategies can help solve this problem by continuing to take advantage of volatility to generate incremental income without duration or credit risk, and allows investors to attach that income to a beta source of their choice. We embrace the prospect for continued volatility, as it is a key ingredient to our success over the long term
As always, we would like to extend an open invitation to serve as a resource for anyone that would like to discuss our views on the markets, particularly as it relates to the relationship between volatility and risk assets. We appreciate your continued support and interest.

Shawn Gibson, CIO, Portfolio Manager
Brad Ball, CEO, Portfolio Manager
Adam Stewart, CFA, Portfolio Manager
Justin Boller, CFA, Portfolio Manager
The assertions and statements in this blog post are based on the opinions of the author and Liquid Strategies. The examples cited in this paper are based on hypothetical situations and should only be considered as examples of potential trading strategies. They do not take into consideration the impact that certain economic or market factors have on the decision making process. Past performance is no indication of future results. Inherent in any investment is the potential for loss.

Manager Commentary: Q1 2021

Manager Commentary: Q2 2020