By Shawn Gibson on Jan 19, 2022

2021 Review
Despite ongoing concerns about COVID, the economy, inflation, interest rates and monetary policy, U.S. Equity markets ripped higher in 2021, with the S&P 500 Index finishing up 28.71% and the S&P 600 Small Cap Index up 26.82%. Bonds mostly finished modestly lower in 2021 due to a sharp move higher in interest rates during the year. The Overlay Strategy was able to benefit from a persistent overpricing of S&P 500 Index options as investors overestimated the levels of future equity volatility. The Overlay Strategy finished 2021 with gross incremental return of 3.63%. This alpha provided a source of outperformance that allowed most of the separate account composites to outperform their benchmarks both for 2021 and Since Inception (11/01/2013).
ANNUALIZED SEPARATE ACCOUNT ILLUSTRATIVE RETURNS (Net1)
11/01/2013 - 12/31/2021
| Q4 | 1 YEARS | 3 YEARS | 5 YEARS | Inception to Date | |
| Large Cap Equity Strategy | 12.14% | 32.20% | 28.54% | 19.56% | 17.49% |
| S&P 500 Index | 11.03% | 28.71% | 26.07% | 18.47% | 15.23% |
| Small Cap Equity Strategy | 6.60% | 30.08% | 22.46% | 13.45% | 14.02% |
| S&P 600 Index | 5.64% | 26.82% | 20.11% | 12.42% | 11.86% |
| Foreign Equity Strategy | 3.53% | 9.78% | 9.86% | 8.87% | 7.58% |
| MSCI ACWI ex US MinVol | 1.82% | 7.82% | 13.18% | 9.61% | 5.22% |
| Core Bond Strategy | 0.89% | 1.03% | 7.04% | 4.84% | 5.48% |
| Bbg Barc US Aggregate Index | 0.01% | -1.54% | 4.79% | 3.57% | 3.18% |
| Short Term Bond Strategy | 0.31% | 2.21% | 6.17% | 4.22% | 4.82% |
| Bbg Barc US Corp 1-5 Yr TR | -0.68% | -0.55% | 3.69% | 2.90% | 2.45% |
| Municipal Bond Strategy | 1.67% | 3.89% | 6.77% | 5.09% | 6.01% |
| Bbg Barc Muni Bond Index | 0.72% | 1.52% | 4.73% | 4.17% | 4.01% |
1Net of fees assumes a 0.75% management fee applied monthly. The three, five and ITD are shown annualized. These returns are illustrative, hypothetical numbers representative of two actual return streams (Liquid Strategies Overlay and the underlying index ETF). The numbers illustrate what would have happened had we taken the underlying index ETF returns and added Liquid Strategy Overlay returns to them. Source: Morningstar, Liquid Strategies.
HEDGED LARGE CAP EQUITY SINCE INCEPTION RETURNS (Net1)
06/30/2019 - 12/31/2021
| Inception to Date | |
| Annualized Return (Net) | 19.05% |
| Annualized Volatility | 9.55% |
| Sharpe Ratio | 1.82 |
| Max Drawdown | -6.23% |
| Beta vs S&P 500 | 0.49 |
| Up Capture | 66.79% |
| Down Capture | 45.01% |
OVERLAY STRATEGY ANNUALIZED PERFORMANCE
11/01/2013 - 12/31/2021
| Q4 | 1 YEARS | 3 YEARS | 5 YEARS | Inception to Date | |
| Overlay Strategy (Gross) | 3.63% | 3.63% | 3.07% | 2.06% | 3.06% |
| Overlay Strategy (Net) | 2.85% | 2.85% | 2.30% | 1.30% | 2.29% |
Net of fees assumes a 0.75% management fee applied monthly.
*Hypothetical/Illustrative performance is not an indicator of future actual results. The results reflect performance of a strategy not offered to investors during the time indicated in the analysis and do not represent returns that any investor actually attained. Hypothetical/Illustrative results are calculated by the retroactive application of the Overlay strategy constructed on the basis of historical data combined with other existing independently-managed ETFs and based on assumptions integral to this presentation which may or may not be testable and are subject to losses. General assumptions include: The manager would have been able to purchase securities in a single portfolio with similar characteristics to the Overlay Strategy and the Index ETFs recommended by the illustration, and the markets were sufficiently liquid to permit all trading. Indexes used for comparative purposes cannot be traded, however there are securities, funds, and similar investments that can be purchased to obtain similar results and include no fees. Changes in these assumptions may have a material impact on the hypothetical returns presented. No representations and warranties are made as to the reasonableness of the assumptions. This information is provided for illustrative purposes only. Actual performance may differ significantly from hypothetical/illustrative performance. Source: Morningstar, Bloomberg, L.P., Liquid Strategies.
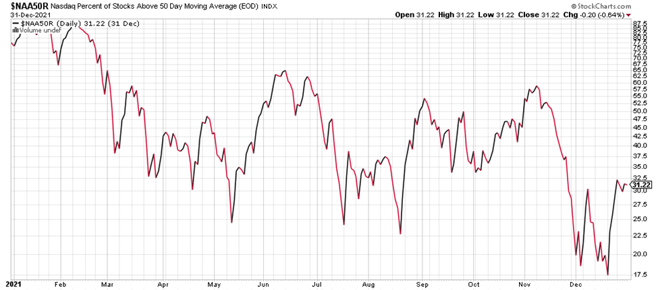
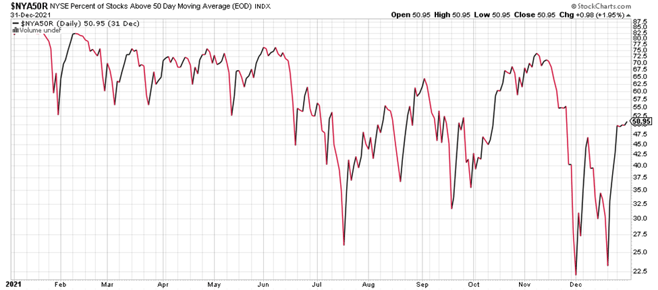
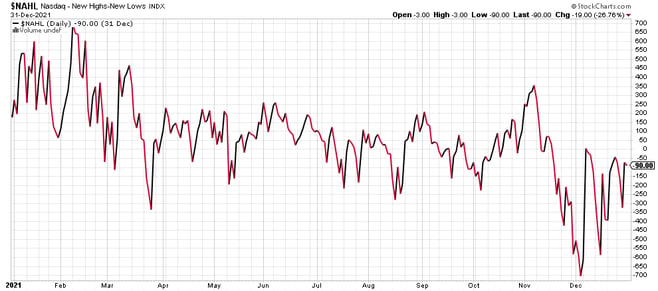
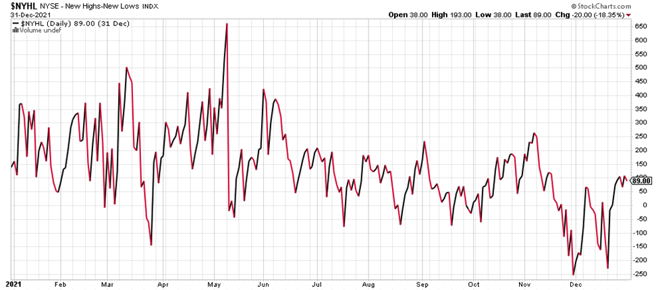
The strong finish in Q4 2021 for the S&P 500 Index (+11.03%) masked some of the turbulence that took place underneath the surface in stocks, in what could best be described as a stealth bear market. As the following charts detail, there was significant deterioration in many individual stocks and in a number of sectors:
-
- Higher valuation NASDAQ stocks got hit hard, with the percentage of the stocks in the index trading above key intermediate-term levels dropping sharply. Most NYSE stocks also broke these key support levels
- NASDAQ and NYSE flipped from most stocks hitting New Highs to most stocks hitting New Lows, indicating a major shift in investor sentiment
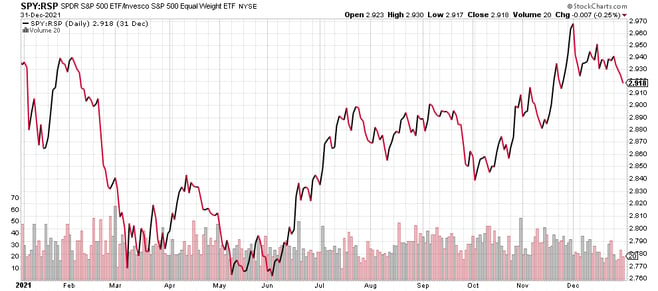
- The cap-weighted S&P 500 Index outperformed the equal-weighted version, as the mega-cap tech stocks that represent a significant over-weighting in the index outperformed the “average stock”
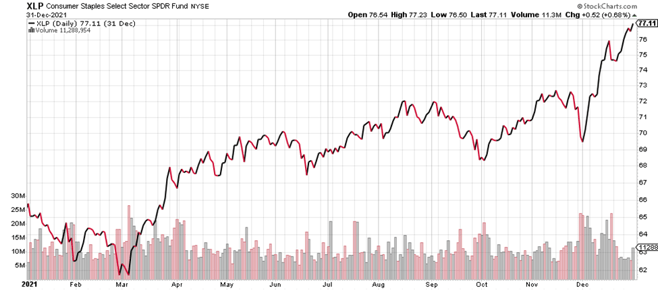
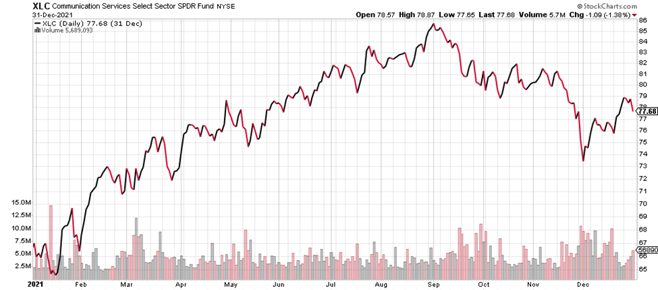
- Some sectors like Consumer Staples had a banner quarter, while others such as Telecommunications gave up much of the year’s gains in the 4th quarter
All of this noise underneath the surface, combined with general anxiety over various global macro factors, caused the level of future volatility estimates being priced into S&P 500 Index options to be too high for the majority of the year. In fact, this mispricing (referred to as the Volatility Risk Premium, which serves as a tailwind for our Overlay Strategy) was the highest it has been since 2009.
The interest rate markets significantly recalibrated in Q4 to what is now expected to be a more hawkish stance by the FOMC, as inflation is no longer considered transitory and as some investors bet that the Fed may be acting too little too late. This shows up quite a bit in the spread between 2-year Treasury bonds and 10-year Treasury. This spread compressed significantly, causing a flattening of the yield curve as investors priced in a number of Fed rate hikes (these impact the shorter end of the curve first), while still not showing meaningful concern over long-term inflation (the 10-year yield would have moved sharply higher if this were a concern). The end result of all of this noise was a modest loss for 2021 in the Bloomberg US Aggregate Bond Index of -1.54%.
2022 Outlook
As we enter the New Year, it appears that the “easy” money in equities has been made and that investors will likely be more discriminating given the risk of a spike in interest rates. A sharp move higher in rates would challenge equity valuations, particularly in the high multiple sectors with high leverage. Given our primary focus on equity volatility (the key source of returns for the Overlay Strategy), here are some of things that we are paying close attention to in 2022:
- Continued inflationary headlines and data could force the Fed to raise rates and reduce the balance sheet much more quickly than the markets are prepared for. After 13 years of very loose monetary policy, a sudden pivot could fuel volatility across all capital markets.
- Global supply chain issues need to be resolved to avoid continued or worsening disruption. If they are not resolved, further producer price increases would either need to be passed on to consumers (bad for demand) or absorbed by companies in the form of margin compression (also bad).
- Investors have used bonds for decades as a portfolio stabilizer, providing a ballast during times of equity volatility. However, an equity selloff driven by a spike in interest rates (causing bonds to lose value) would cause that relationship to suffer, leading investors to rethink their overall portfolio allocations.
- The increased adoption and availability of COVID-19 vaccines has the potential to help us get over the hump of this pandemic, but the risk of more deadly variants down the road serves as a wild card.
- The mid-term elections have the potential to once again realign the political landscape in Congress which could have a meaningful impact on potential fiscal policies over the next 2 years.
While these issues might seem to paint a dire picture, there is a positive scenario whereby inflation indicators begin to moderate before a significant tightening in monetary policy, thereby creating a more positive backdrop for equities and bonds. Also, despite the move higher in interest rates, Fed Funds rates and longer-term interest rates are still well below historical averages, providing both motivation for borrowing as well as incentive to buy stocks given a perceived better risk/reward profile for some areas of the market.
Even if many of these issues are resolved, the likely scenario would still be that investors will continue to be nervous and thus continue to overestimate future equity volatility, resulting in an attractive opportunity set for the Overlay Strategy. We do expect a bumpy path in 2022 and will continue to be diligent in managing risk and taking a conservative approach.
As always, we would like to extend an open invitation to serve as a resource for anyone that would like to discuss our views on the markets, particularly as it relates to the relationship between volatility and risk assets. We appreciate your continued support and interest.

Shawn Gibson, CIO, Portfolio Manager
Adam Stewart, CFA, Portfolio Manager
Justin Boller, CFA, Portfolio Manager
The assertions and statements in this blog post are based on the opinions of the author and Liquid Strategies. The examples cited in this paper are based on hypothetical situations and should only be considered as examples of potential trading strategies. They do not take into consideration the impact that certain economic or market factors have on the decision making process. Past performance is no indication of future results. Inherent in any investment is the potential for loss.

Manager Commentary: Q3 2020

Manager Commentary: Q2 2020