By Shawn Gibson on Jul 12, 2019

Although the quarter included a sharp volatility spike in May and overall large swings in the equity markets, the Theta Income Strategy was able to generate a net return of 0.94% for the 2nd quarter, bringing the YTD net return to 4.00%. On a longer-term basis, the Theta Income Strategy continues to provide compelling absolute and risk-adjusted returns relative to bonds.
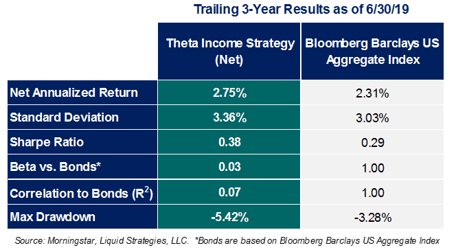
While the table above illustrates the long-term ability of the Theta Income Strategy to generate attractive returns relative to bonds with only modestly higher volatility, this volatility relationship has trended very favorably so far in 2019 for the Theta Income Strategy. From the start of the year through 6/30/19, the annualized standard deviation of the daily returns of Theta Income has been only 2.08% compared to 2.84% for the Bloomberg Barclay’s US Aggregate Bond Index. The volatility of the Strategy can be attributed to a combination of two things:
1) Focus on a shorter-duration, high-quality bond portfolio that is far less sensitive to changes in interest rates
2) Disciplined risk management in our option overlay portfolio
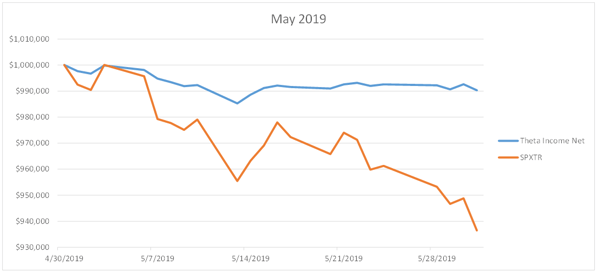
The focus on risk management is clear when comparing the daily movement of the Strategy relative to the equity markets during the month of May where the S&P 500 Index was down 6.35% while the Strategy was only down 0.96%.
Our thesis entering 2019 was that 2018 was an inflection point in the long-term trend of equity volatility. These long-term trends of low volatility vs. high volatility tend to last about 5 years with the most recent ultra-low volatility cycle reaching over 6 years as of the end of 2018.
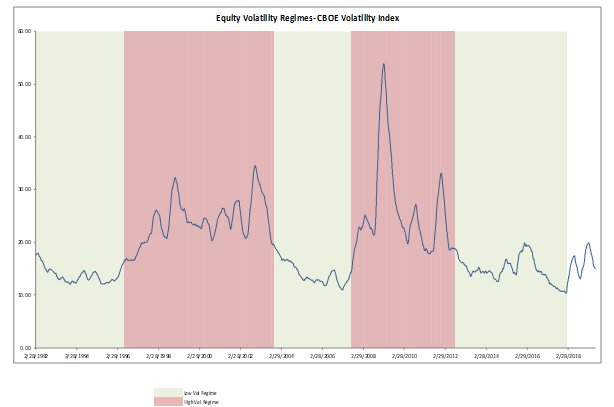
There are a number of factors that could impact short-term and intermediate-term volatility in the second half of 2019. The most obvious are trade tensions and global monetary policy. The market will continue to react with force to any positive or negative news relating to global trade relations or central bank dovish or hawkish comments and actions. The key to increasing long-term volatility is the outlook for the business cycle, and specifically the risk and potential magnitude/duration of the next recession. The next high volatility regime will coincide with the next recession, and will likely begin well ahead of a confirmed recession. A number of recession indicators utilized by economists have shown a continued increase of the probability of a recession in the next 12-18 months, and these probabilities will likely increase significantly with an escalation of global trade wars. Even without such an escalation, there is still concern that overall economic growth trends and the limited tools at the disposal of the Fed, given an already accommodative monetary policy, will be able to fend off the recessionary pressures. In short, long-term equity returns and volatility trends coincide with earnings growth, which are directly impacted by economic growth (rapid growth equals higher earnings/markets and lower volatility, while negative growth equals lower earnings/markets and higher volatility). By the end of the year, a much clearer picture of the state of the economy should emerge.
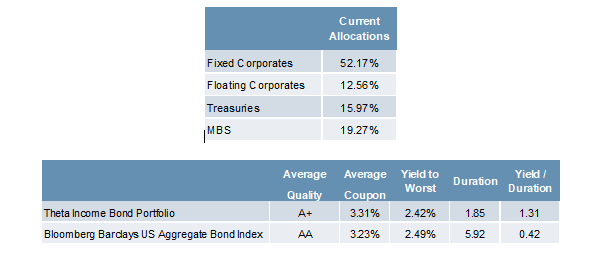
Bonds continued their torrid run with the Bloomberg Barclays US Aggregate Bond Index rising over 3% during the quarter. The tariff-driven equity market volatility in May provided the catalyst for a flight to quality which led to heightened expectations that the Federal Reserve will move to lower rates at their July meeting. Treasury yields have fallen about 70bps in the first 6 months of the year and 125bps since November of 2018. The sharp decline in interest rates has led to positive returns for the bond component of the Theta Income Strategy, although our shorter duration approach failed to fully keep pace with more interest rate sensitive segments of the bond market. Given the current low yield environment across the curve, a sentiment that multiple rate cuts by the Fed are already priced into the market, and that much of the short to intermediate segment of the curve remains inverted, we continue to find value from an absolute return perspective in the shorter end of the yield curve.
Following is a breakdown of the composition of the bond segment of the Theta Income Strategy as of 6/30/2019:
For nearly 6 years, the Theta Income Strategy has delivered a highly risk-controlled overlay to investors to provide them with attractive incremental return above and beyond a conservative bond portfolio. Given the conservative nature of this overlay, it can be effectively applied to a variety of underlying sources of beta including bonds and equities (both U.S. and Foreign). In order to allow advisors and their clients greater flexibility in accessing and implementing this overlay, in the coming months we will be announcing a new suite of solutions that will allow for significantly more flexibility.
As always, we appreciate your continued support and interest.
Learn more about our offerings...


Important Disclosures
Past performance is no indication of future results. Inherent in any investment is the potential for loss. The adviser may not achieve the stated annual return objective. This commentary is not meant as a general guide to investing, nor as a source of any specific investment recommendations. This commentary makes no implied nor express recommendations concerning the manner in which any client’s accounts should or would be handled.
With regard to indices presented herein, please note the volatility of the indices may be materially different from the individual performance attained by a specific investor. In addition, the portfolio’s holdings may differ significantly from the securities that comprise the indices. The indices have not been selected to represent an appropriate benchmark to compare an investor’s performance, but rather are disclosed to allow for comparison of the investor’s performance to that of certain well-known and widely recognized indices. You cannot invest directly in an index.
Performance is presented net of fees and was calculated using standard management fees of 1.00% annually. For further details on fees, please refer to Part 2A of Adviser’s Form ADV. Inherent in any investment is the potential for loss. Past performance results are not necessarily indicative of future performance results.
The account’s performance has been compared to the following indices. Index returns illustrated would be lower if transaction costs and fees for asset management were deducted. Information regarding the index contained in this report is from sources deemed to be reliable however; the Adviser does not guarantee the accuracy or completeness of such information.
The investments and services to which this presentation relates are only available to persons with a categorization as a qualified client, as defined under Rule 205-3 of the Investment Adviser Act of 1940, and other persons should not act or rely on it.
S&P 500 Total Return Index - An index of 500 stocks chosen for market size, liquidity and industry grouping, among other factors. The S&P 500 is designed to be a leading indicator of U.S. equities and is meant to reflect the risk/return characteristics of large cap stocks. All cash distributions (e.g. dividends and income) are reinvested. Used as a proxy for "Stocks" above.
Barclay’s U.S. Aggregate Bond Index - A broad-based index of bond securities used to represent investment-grade bonds traded in the U.S. The index was formerly known as the “Lehman Aggregate Bond Index”. Used as a proxy for "Bonds" above.
CBOE Volatility Index ("VIX") - An index sponsored by the Chicago Board of Options Exchange (CBOE) that shows the market's expectation of 30-day volatility. It is constructed using the implied volatilities of various option expirations and various strike prices of S&P 500 index options.
Correlation (R2) - A statistical measure of how two financial instruments (e.g. securities, indices, etc.) move in relation to each other. A correlation of +1 implies that as one security moves, either up or down, the other security will move in lockstep, in the same direction. Alternatively, the closer correlation is to 0, the less the movements of two securities are related to one another.
Beta - A measure of the portfolio’s sensitivity to changes in the benchmark. A beta of 1 indicates the portfolio has historically moved with the benchmark. A portfolio beta greater than 1 indicates the portfolio has been more volatile than the benchmark and a portfolio beta less than one indicates the portfolio has been less volatile than the benchmark. Beta in this presentation is calculated using monthly historical returns.
Sharpe Ratio - A measure for calculating risk-adjusted return. The Sharpe ratio is the average return earned in excess of the risk-free rate per unit of volatility or total risk. Subtracting the risk-free rate from the mean return, the performance associated with risk-taking activities can be isolated. Sharpe ratio = (Mean portfolio return − Risk-free rate)/Standard deviation of portfolio return. For Sharpe Ratio calculations in this presentation, the “risk free rate” is represented by the annualized monthly returns of the 3 Month US T-Bill.
Max Drawdown - A measure of the largest single drop from peak to trough based on monthly portfolio returns
HFRX Absolute Return Index - A stock index designed to measure absolute returns. The absolute return index is actually a composite index made up of five other indexes. This index is used to compare the absolute returns posted by the hedge fund market as a whole against individual hedge funds.
Standard Deviation - A measure of the dispersion of a set of data from its mean.

Manager Commentary: Q4 2019

Liquid Strategies Q2 2020 Manager Commentary and Volatility Outlook Webinar