By Shawn Gibson on Jan 25, 2021

Despite lingering volatility in the 4th quarter and a tumultuous 2020 for the capital markets, our focus on risk management and ability to take advantage of equity volatility resulted in our income-based Overlay Strategy generating gross income of 1.06% for the quarter, bringing the 2020 total gross income produced to 2.27%. The Strategy continues to demonstrate the ability to generate positive long-term incremental income to underlying beta sources in a variety of market conditions (we saw both extremes in 2020). For investors that would have been invested in these various strategies since the inception of the firm, below are the illustrative long-term performance results:
| Overlay Strategy Returns through 12/31/20 | |
| Q4 2020 | 1 YEAR |
| 1.06% (Gross) | 2.27% (Gross) |
| 0.87% (Net) | 1.50% (Net) |
Net of fees assumes a 0.75% management fee applied monthly.
ANNUALIZED SEPARATE ACCOUNT ILLUSTRATIVE RETURNS (Net1)
11/01/2013 - 12/31/2020
| 1 YEARS | 3 YEARS | 5 YEARS | Inception to Date | |
| Large Cap Equity Strategy | 19.58% | 12.88% | 17.06% | 15.57% |
| S&P 500 Index | 18.40% | 14.18% | 15.22% | 13.46% |
| Small Cap Equity Strategy | 12.45% | 6.55% | 14.14% | 11.94% |
| S&P 600 Index | 11.29% | 7.74% | 12.37% | 9.92% |
| Foreign Equity Strategy | 2.62% | 2.31% | 7.96% | 7.28% |
| MSCI ACWI ex US | 10.65% | 4.88% | 8.93% | 4.86% |
| Core Bond Strategy | 9.11% | 4.65% | 6.43% | 6.12% |
| Bbg Barc US Agg Index | 7.51% | 5.34% | 4.44% | 3.85% |
| Municipal Bond Strategy | 6.69% | 3.71% | 5.55% | 6.31% |
| Bbg Barc Muni Bond Index | 5.21% | 4.64% | 3.91% | 4.37% |
1Net of fees assumes a 0.75% management fee applied monthly. These returns are illustrative, hypothetical numbers representative of two actual return streams (Liquid Strategies Overlay and the underlying index ETF). The numbers illustrate what would have happened had we taken the underlying index ETF returns and added Liquid Strategy Overlay returns to them. Source: Morningstar, Liquid Strategies.
OVERLAY STRATEGY ANNUALIZED PERFORMANCE
11/01/2013-12/31/2020
| 1 YEAR | 3 YEARS | 5 YEARS | Inception to Date | |
| Overlay Strategy (Gross) | 2.27% | 0.14% | 2.74% | 2.98% |
| Overlay Strategy (Net) | 1.50% | -0.61% | 1.97% | 2.22% |
Net of fees assumes a 0.75% management fee applied monthly.
*Hypothetical/Illustrative performance is not an indicator of future actual results. The results reflect performance of a strategy not offered to investors during the time indicated in the analysis and do not represent returns that any investor actually attained. Hypothetical/Illustrative results are calculated by the retroactive application of the Overlay strategy constructed on the basis of historical data combined with other existing independently-managed ETFs and based on assumptions integral to this presentation which may or may not be testable and are subject to losses. General assumptions include: The manager would have been able to purchase securities in a single portfolio with similar characteristics to the Overlay Strategy and the Index ETFs recommended by the illustration, and the markets were sufficiently liquid to permit all trading. Indexes used for comparative purposes cannot be traded, however there are securities, funds, and similar investments that can be purchased to obtain similar results and include no fees. Changes in these assumptions may have a material impact on the hypothetical returns presented. No representations and warranties are made as to the reasonableness of the assumptions. This information is provided for illustrative purposes only. Actual performance may differ significantly from hypothetical/illustrative performance. Source: Morningstar, Bloomberg, L.P., Liquid Strategies.
The steep rally across virtually all segments of the equity markets in the 4th quarter capped an amazing comeback from the March lows, ending the year at new all-time highs with extremely high bullish equity sentiment. The S&P 500 Index, for example, was down over 35% on an intra-day basis in a month during the 1st quarter (including the 3rd largest single day selloff of 12% on March 16th), but fully recovered those losses within 6 months and managed to finish the year with an 18.40% total return. The velocity of the drawdown and subsequent recovery were unprecedented, forcing investors to increasingly allocate to equities as the year progressed, creating a positive feedback loop for stocks.
The opportunity set for our income Overlay Strategy is influenced by volatility in the U.S markets. Volatility that is falling/stable tends to be the ideal backdrop for the Strategy while rapidly rising volatility diminishes the opportunity set in the short term. As such, our process is designed to lead the team to reduce exposure in the Strategy during times of extreme market stress where our quantitative volatility risk model indicates a high risk of a volatility spike. In the 1st quarter, our risk model led us to reduce/eliminate our positions for 29 consecutive days. These periods of Elevated/High Risk typically last closer to 7-8 trading days, demonstrating the extreme nature of the drawdown. During the remainder of the year, there were four more relative short-lived volatility episodes where our model indicated Elevated/High Risk. By the end of the year, approximately 75% of the trading days were in what we deem to be Normal Risk compared to a typical year of 85-90%. While reducing positions during Elevated/High Risk can result in opportunity cost, the risk management benefits can far outweigh those costs in a scenario like March. Following are some key metrics that illustrate the extraordinary level of volatility in equities:
- The realized volatility in 2020 was the 6th highest ever for the S&P 500 Index (34.5% vs. 41% in 2008, 37% in 1929, 40% in 1931, 53% in 1932 and 48% in 1933)1
- The CBOE S&P 500 Volatility Index (“the VIX”) had its highest closing level of 82.69, and fell just short of an intra-day high of 89.53
- The CBOE Volatility of VIX (“the VVIX”) which essentially measures how fast volatility is moving hit an all-time high of 207.59
- The VIX had an average closing level of 29.25, the highest level since 2009 and the 3rd highest level since the index started in 1990
- The S&P 500 Index had daily moves (up or down) of at least 2% 44 times compared to 7 in 2019, 20 in 2018 and 0 in 2017. The average number of such moves since 2009 to the end of 2019 was just 12.
1 Source: UBS Securities
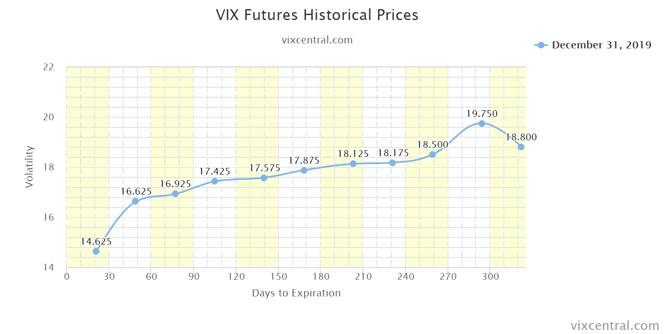
VIX future curves can be an interesting tool for seeing what levels of future volatility the market expects. Below are snapshots of these curves at three points in time:
1. 12/31/2019 when equity markets were very complacent and investors were bullish
.png?width=1622&name=2-vix-futures-historical-p%20(1).png)
3. 12/31/2020 as markets hit new highs and sentiment was extremely bullish
.png?width=1603&name=3-vix-futures-historical-p%20(2).png)
As the charts show, when 2019 ended, the markets were expecting very little volatility over the short term and long term. Even long-term volatility estimates were below the long-term average of right around 20. The curve had an upward sloping curve which is typical for most normal market environments. At the market lows on March 23rd, both short-term and long-term volatility estimates exploded, with a significant risk premium being priced in the front 3 months. This risk premium created an inverted futures curve, a key sign of extreme market fear. These inverted curves tend to be short lived as short-term volatility estimates tend to move down much more quickly as market volatility subsides. By the end of the year, the curve returned to being upward sloping on the front end but is relatively flat 2-8 months out. In fact, longer-term volatility estimates did not drop that much from the 3/23/2020 levels compared to the sharp decline on the front end. This is a clear sign that despite the extreme bullish equity sentiment at the end of the year, the market is still pricing in COVID tail risk that could come with a slowdown or reversal in the economic recovery.
Investors are facing two key risks as we move into the New Year. First, the unprecedented monetary and fiscal stimulus in 2020, along with further potential stimulus in 2021, has the potential to further fuel the economic recovery, and with that comes the risk of rising interest rates for bond investors. The potential duration risk relative to current yields creates an unfavorable risk/return profile. Second, a continued rise in the equity markets will eventually lead to stretched valuations and sentiment, leaving the equity markets vulnerable to an “air pocket” that has the potential to create another round of extreme volatility. In response to these key risks, we are offering investors two additional solutions to address these problems:
- Short Term Bond Strategy – Combines the benefits of owning short-duration bonds with the same income potential from the income Overlay Strategy. This combination has the ability to significantly improve the risk/reward profile for bond investors concerned about duration risk.
- Hedged Large Cap Equity Strategy – Combines the benefits of owning the S&P 500 Index with long-term bear market hedges that are financed by the income Overlay Strategy. This combination has the ability to allow investors to participate in future market appreciation without the typical caps created by covered calls, while having the peace of mind to stay fully invested even during times of stress due to the market hedges.
For investors that would have been invested in the Short Term Bond Strategy since the inception of the firm, below are the illustrative long-term performance results:
ANNUALIZED SEPARATE ACCOUNT ILLUSTRATIVE RETURNS (Net1)
11/01/2013 - 12/31/2020
| 1 YEAR | 3 YEARS | 5 YEARS | Inception to Date | |
| Short Term Bond Strategy | 6.70% | 3.68% | 5.58% | 5.19% |
| Bloomberg Barclays US Corp. 1-5 Year TR | 5.41% | 4.42% | 3.73% | 3.07% |
Below is a snapshot the net performance of the Hedged Large Cap Equity Strategy since the inception of the strategy on 6/30/2019:
HEDGED LARGE CAP EQUITY SINCE INCEPTION RETURNS (Net1)
06/30/2019 - 12/31/2020
| Hedged Large Cap Equity | S&P 500 TR | |
| Annualized Return - Net | 17.22% | 19.93% |
| Annualized Volatility | 10.14% | 21.15% |
| Beta vs S&P 500 | 0.44 | 1.00 |
| Sharpe Ratio | 1.53 | 0.92 |
| Max Drawdown | -6.23% | -19.60% |
As we move into 2021 (finally!), it is important to remember that while market sentiment and equity valuations are important to consider when making investing decisions, they tend to be poor short-term timing mechanisms. Both bullish sentiment and valuations can stay high for extended periods of time in certain environments (just as they can reach and stay in extreme levels during times of stress). There is no hard cap for how overbought markets can get. With that said, the addition of the Short-Duration Bond Strategy and the Hedged Large Cap Equity Strategy provide even more tools to allow investors to adapt to changing market risks and opportunities.
As always, we would like to extend an open invitation to serve as a resource for anyone that would like to discuss our views on the markets, particularly as it relates to the relationship between volatility and risk assets. We appreciate your continued support and interest.

Shawn Gibson, CIO, Portfolio Manager
Brad Ball, CEO
Adam Stewart, CFA, Portfolio Manager
Justin Boller, CFA, Portfolio Manager
The assertions and statements in this blog post are based on the opinions of the author and Liquid Strategies. The examples cited in this paper are based on hypothetical situations and should only be considered as examples of potential trading strategies. They do not take into consideration the impact that certain economic or market factors have on the decision making process. Past performance is no indication of future results. Inherent in any investment is the potential for loss.
Manager Commentary: Q4 2019

Manager Commentary: Q4 2022