By Shawn Gibson on May 05, 2020

After multiple daily moves over 9% in the S%P 500 Index in March (including one down day of almost 12%), market volatility has contracted significantly since the March 23rd bottom. One way to measure volatility is to look at the average daily moves of the market (regardless of direction) to quantify the daily price swings. In March, the average daily move of the S&P 500 Index was 4.95% (it moved up or down on average 4.95% a day).
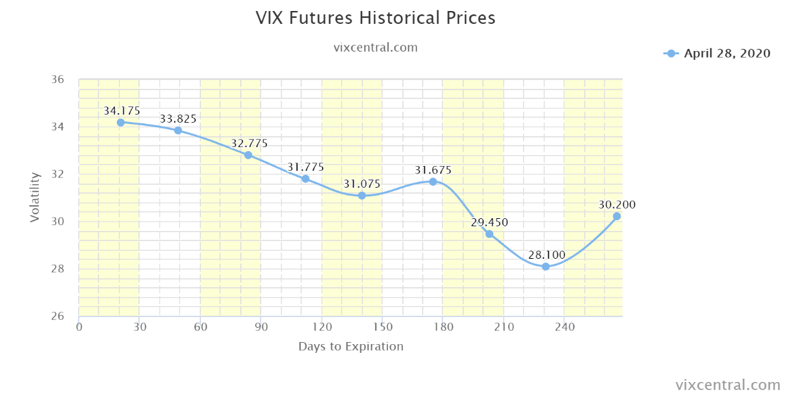
For the month of April (through 4/28/20), the average daily move for index was “only” 2.13%, which is still well above historical norms. This tightening of daily moves explains why the CBOE Volatility Index (the “VIX”) has dropped to the low 30s from over 80. Keeping in mind that a VIX of 32 roughly equates to an estimated daily move of 2%, the index seems fairly priced based on the market movement over the past month. The million dollar question is whether this drop in volatility is temporary or is part of a longer-term downward trend. While there are factors that support either case, it is useful to see how market participants see volatility for the remainder of the year by looking at VIX futures, which price in where traders see the VIX at various points in the future.
The following chart shows the VIX futures curve as of the close 4/28/20, indicating that the market is estimating the VIX will stay close to 30 through the election and drop off afterwards. The “kink” in the curve in October is solely linked to anticipated volatility around the election.
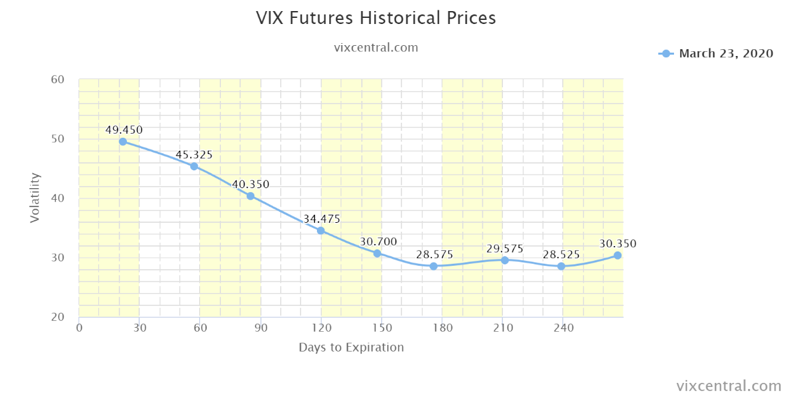
For comparison purposes, this is what the VIX futures curve looked like on March 23rd when the market expected much higher near-term volatility.
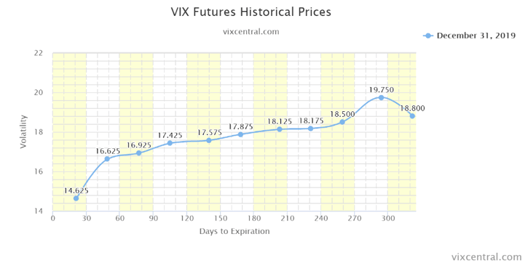
Finally, here is what the VIX futures curve looked like at the end of 2019 when complacency was near a peak. At that time, the highest level on the curve (19.75) was 10 points lower than the lowest point of the current VIX curve (28.10), showing a major shift in future volatility expectations.
In summary, the current market expectation is that elevated volatility will likely stay with us for the remainder of the year. This expectation makes sense given the potential volatility of earnings reports and economic data over the coming quarters. However, the extreme level of monetary fiscal stimulus will make it much more difficult for volatility to reach the levels that we saw in March.
Learn more about Liquid Strategies and our offerings.
The assertions and statements in this blog post are based on the opinions of the author and Liquid Strategies. The examples cited in this paper are based on hypothetical situations and should only be considered as examples of potential trading strategies. They do not take into consideration the impact that certain economic or market factors have on the decision making process. Past performance is no indication of future results. Inherent in any investment is the potential for loss.

COVID-19 & Its Effect on the Market

Manager Commentary: Q2 2020