By Shawn Gibson on Oct 22, 2025

FUND OVERVIEWS
The Overlay Shares suite of ETFs seeks to provide incremental yield on top of low-cost market beta ETFs by utilizing a highly risk-controlled put spread writing strategy ("the Overlay Strategy") on the S&P 500 Index. If successful, the ETFs have the ability to provide higher yield and higher total return than holding the underlying ETFs alone. The Overlay Strategy is applied and managed the same way in six of the seven Overlay Shares funds:
| FUND NAME | BETA EXPOSURE | INCEPTION DATE | GROSS EXPENSE RATIO |
| Overlay Shares Large Cap Equity ETF (OVL) | US Large Cap Equity | 09/30/2019 | 0.79% |
| Overlay Shares Small Cap Equity ETF (OVS) | US Small Cap Equity | 09/30/2019 | 0.83% |
| Overlay Shares Foreign Equity ETF (OVF) | International Equity | 09/30/2019 | 0.83% |
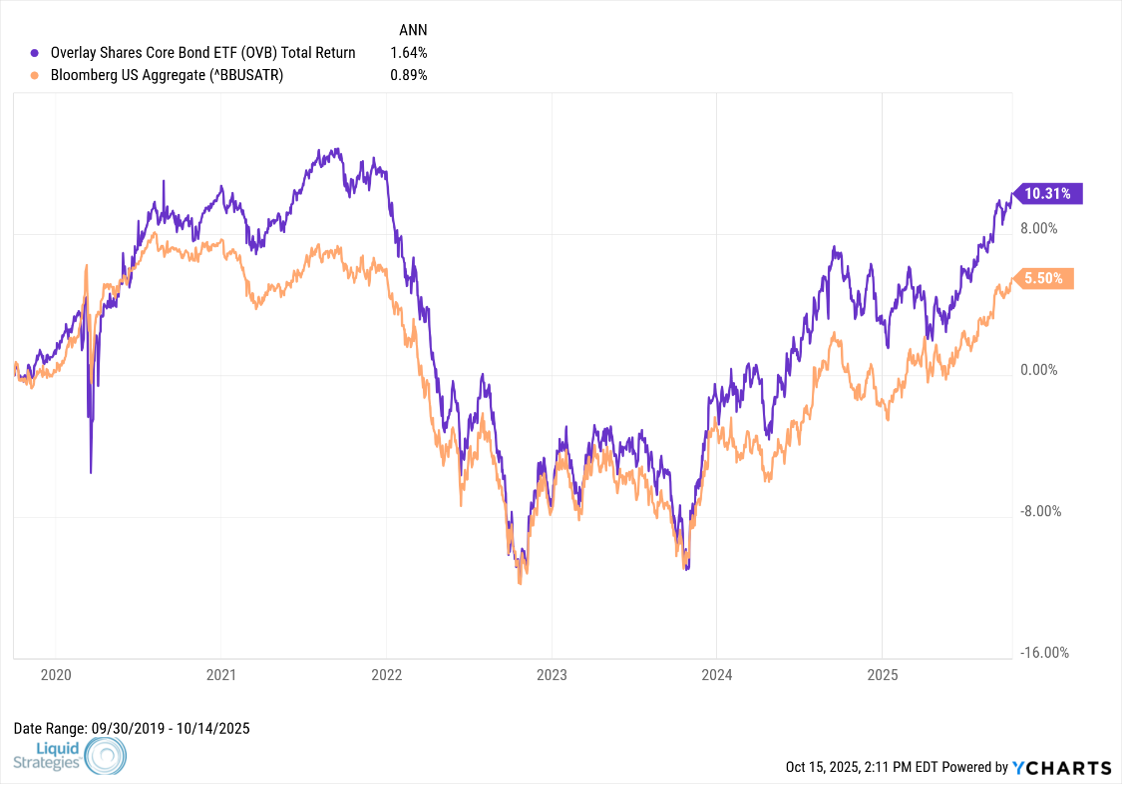
| Overlay Shares Core Bond ETF (OVB) | Broad Investment Grade Bond | 09/30/2019 | 0.79% |
| Overlay Shares Municipal Bond ETF (OVM) | Municipal Bond | 09/30/2019 | 0.83% |
| Overlay Shares Short Term Bond ETF (OVT) | Short Term Corporate Bond | 01/14/2021 | 0.80% |
| Overlay Shares Hedged Large Cap Equity ETF (OVLH) | Hedged US Large Cap Equity | 01/14/2021 | 0.85% |
The Overlay Shares Hedged Large Cap ETF (OVLH) maintains laddered downside hedges to protect the portfolio against significant market drawdowns.
PERFORMANCE OVERVIEW
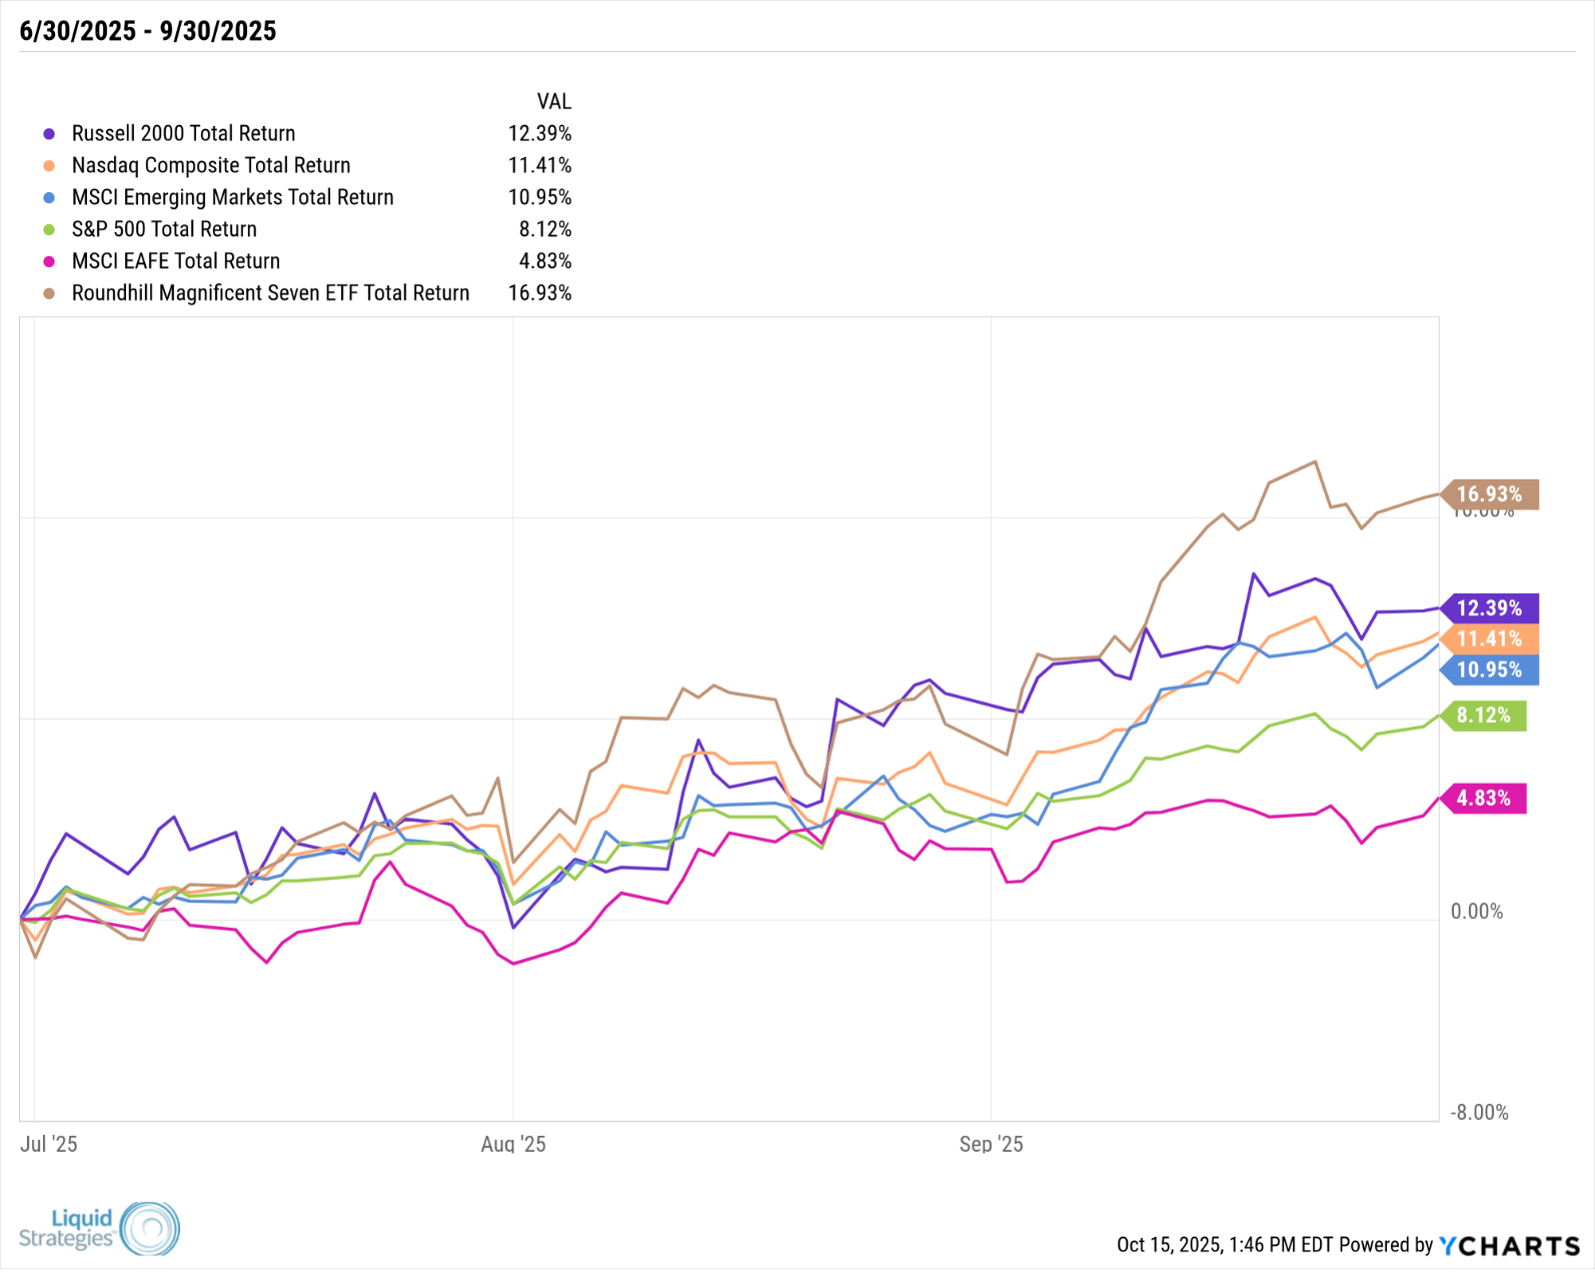
For the 3rd Quarter of 2025, equity markets continued their move higher setting new all-time highs as investors continued to show optimism that we will see more rate cuts that could create a combination of robust economic growth and tame inflation. The S&P 500 Index finished the quarter up 8.12% Small cap stocks, which may benefit more from lower interest rates, outperformed large-cap stocks with the Russell 2000 Index up 12.39% for the quarter. Non-U.S. stocks, as measured by the MSCI EAFE Index, lagged U.S. stocks with a gain of 4.83%.
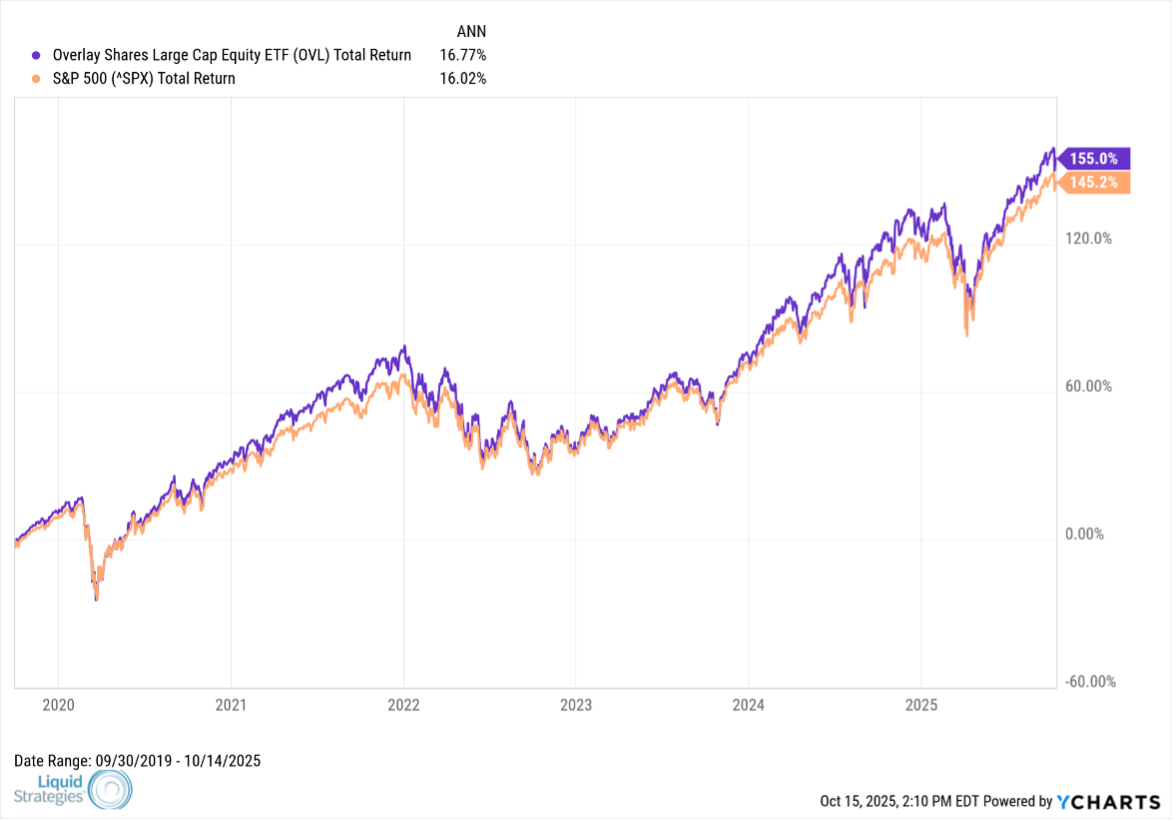
A combination of rising equity prices and muted equity volatility was supportive for the Overlay Strategy, logging a positive contribution of about 1.09%. The gain in the quarter directly contributed to the outperformance of the six funds that utilize the Strategy. The Overlay Shares Hedged Large Cap (OVLH) does not utilize the Overlay Strategy but instead maintains laddered downside hedges. Unlike the Overlay Strategy, these hedges can result in a drag on returns when equities are rising and volatility is declining. As such, the fund underperformed the S&P 500 Index with a return of 5.79%.
FUND PERFORMANCE*
| Q3 '25 | YTD | 1 YEAR | 3 YEARS | Inception to Date | |
| OVL NAV Returns | 9.07% | 14.34% | 16.42% | 26.55% | 16.77% |
| OVL Market Price Returns | 9.17% | 14.16% | 16.43% | 26.49% | 16.77% |
| S&P 500 Total Return Index | 8.12% | 14.83% | 17.60% | 26.94% | 16.25% |
| OVS NAV Returns | 10.10% | 4.02% | 2.80% | 14.28% | 9.59% |
| OVS Market Price Returns | 9.80% | 4.02% | 2.76% | 14.29% | 9.59% |
| S&P 600 Total Return Index | 9.11% | 4.24% | 3.64% | 12.82% | 9.09% |
| OVF NAV Returns | 6.56% | 26.80% | 15.73% | 20.93% | 7.16% |
| OVF Market Price Returns | 6.47% | 26.79% | 15.78% | 21.08% | 7.16% |
| MSCI All Country World ex USA Index | 6.89% | 26.02% | 16.45% | 20.67% | 9.01% |
| OVB NAV Returns | 2.96% | 6.32% | 2.45% | 6.67% | 1.54% |
| OVB Market Price Returns | 3.06% | 6.11% | 2.41% | 6.68% | 1.53% |
| Bloomberg US Aggregate Bond Index | 2.03% | 6.13% | 2.88% | 4.93% | 0.75% |
| OVM NAV Returns | 3.67% | 2.10% | 0.52% | 5.86% | 2.07% |
| OVM Market Price Returns | 3.82% | 2.03% | 0.41% | 5.92% | 2.09% |
| Bloomberg Municipal Bond Index | 3.00% | 2.64% | 1.39% | 4.74% | 1.39% |
| OVT NAV Returns | 2.58% | 5.55% | 4.48% | 8.00% | 2.56% |
| OVT Market Price Returns | 2.29% | 5.46% | 4.45% | 7.99% | 2.55% |
| Bloomberg US Corporate 1-5 Years TR Index | 1.62% | 5.48% | 5.06% | 6.22% | 2.16% |
| OVLH NAV Returns | 5.88% | 14.18% | 15.55% | 18.03% | 10.43% |
| OVLH Market Price Returns | 5.79% | 14.29% | 15.83% | 17.98% | 10.45% |
| S&P 500 Total Return Index | 8.12% | 14.83% | 17.60% | 24.94% | 14.47% |
*Returns are Net of fees
Inception for OVL, OVS, OVF, OVB, OVM is 09/30/2019. Inception for OVLH and OVT is 01/14/2021.
Performance data quoted represents past performance and is no guarantee of future results. Investment return and principal value of an investment will fluctuate so that an investor's shares, when redeemed, may be worth more or less than their original cost. Current performance may be lower or higher than the performance data quoted. For the most recent month-end performance, please call 1-866-704-OVLS.
Overlay Shares are bought and sold at market price (not NAV) and are not individually redeemed from the Fund. Total Returns are calculated using the daily 4:00pm EST net asset value (NAV). Market price returns reflect the midpoint of the bid/ask spread as of the close of trading on the exchange where Fund shares are listed. Market price returns do not represent the returns you would receive if you traded shares at other times.
MARKET OVERVIEW
Equity markets were up across the board, with Small Cap and Technology stocks leading the way. The “Magnificent 7” stocks fueled much of the return of large cap equities with a return of about 16.93%.
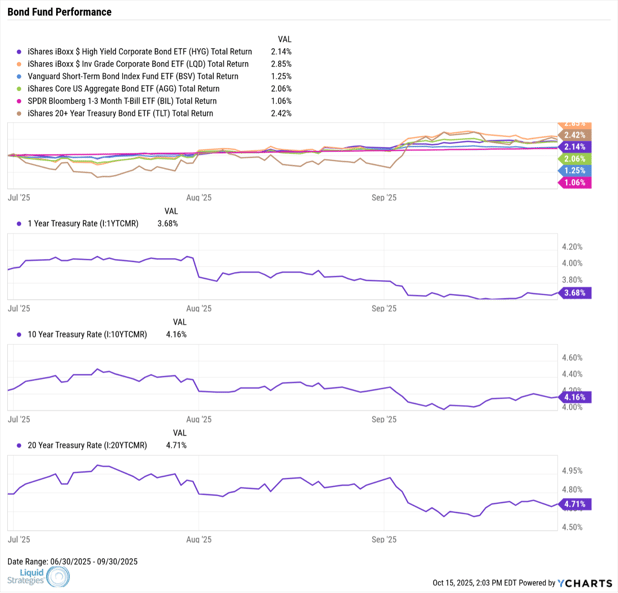
Interest rates moved lower in the quarter, supporting bond prices.
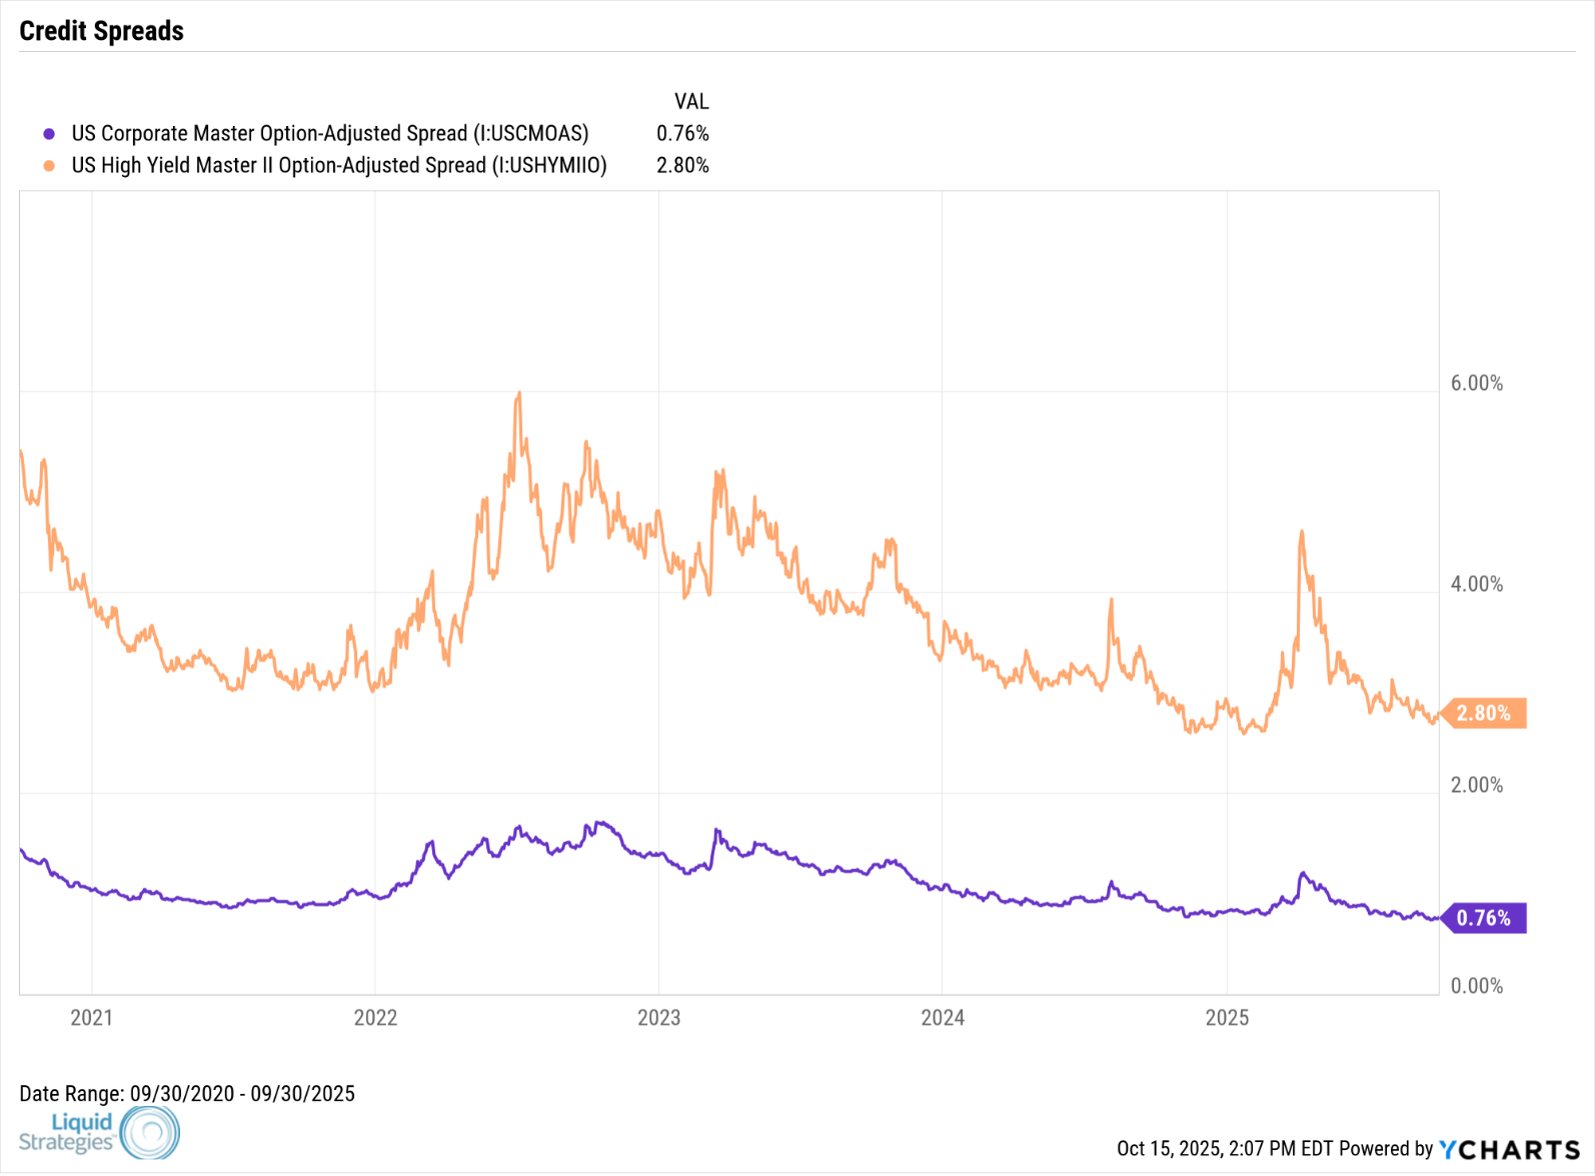
Credit spreads continued to sit near all-time lows, providing a further tailwind for bonds, particularly high yield.
The positive returns in the Overlay Strategy allowed our core funds (Overlay Shares Large Cap Equity ETF and Overlay Shares Core Bond ETF) to continue to outperform their respective benchmarks since inception.
While the markets were able to continue to shake off the volatility spike in the 1st quarter, the path forward is not without risks. A stagflationary (where growth slows but inflation rises) environment would be a significant headwind for both stocks and bonds. In this environment, slower economic growth would mean lower corporate profits leading to a potential adjustment lower in equity valuations. Higher inflation could result in a sharp move higher in interest rates, which would cause a reset lower in bond prices. A major escalation in global trade wars via tariffs and other restrictive actions is an example of possible catalyst for such an environment. In stagflationary environments, bonds may not act like the ballast in a portfolio, similar to what happened in 2022. It may be prudent to look at other potential ballasts where risk can be controlled directly with hedges. An investment like the Overlay Shares Hedged Equity Fund (OVLH) seeks to participate in market upside while employing a laddered hedging strategy designed to help mitigate the impact of significant market declines.
As always, we are happy to not only do calls and meetings to discuss the performance and outlook of our strategies, but we are also happy to serve as a resource for general questions on market volatility.
We appreciate your continued support and interest.

Shawn Gibson, Founding Member
Adam Stewart, CFA, Portfolio Manager
Important Disclosures
Past performance is no indication of future results. Inherent in any investment is the potential for loss. The adviser may not achieve the stated annual return objective. This commentary is not meant as a general guide to investing, nor as a source of any specific investment recommendations. This commentary makes no implied nor express recommendations concerning the manner in which any client’s accounts should or would be handled.
With regard to indices presented herein, please note the volatility of the indices may be materially different from the individual performance attained by a specific investor. In addition, the portfolio’s holdings may differ significantly from the securities that comprise the indices. The indices have not been selected to represent an appropriate benchmark to compare an investor’s performance, but rather are disclosed to allow for comparison of the investor’s performance to that of certain well-known and widely recognized indices. You cannot invest directly in an index.
Performance is presented net of fees and was calculated using standard management fees of 1.00% annually. For further details on fees, please refer to Part 2A of Adviser’s Form ADV. Inherent in any investment is the potential for loss. Past performance results are not necessarily indicative of future performance results.
The account’s performance has been compared to the following indices. Index returns illustrated would be lower if transaction costs and fees for asset management were deducted. Information regarding the index contained in this report is from sources deemed to be reliable; however, the Adviser does not guarantee the accuracy or completeness of such information.
The investments and services to which this presentation relates are only available to persons with a categorization as a qualified client, as defined under Rule 205-3 of the Investment Adviser Act of 1940, and other persons should not act or rely on it.
The Overlay Shares ETFS are distributed by Foreside Fund Services, LLC, which is not affiliated with the Adviser.
S&P 500 Total Return Index - An index of 500 stocks chosen for market size, liquidity and industry grouping, among other factors. The S&P 500 is designed to be a leading indicator of U.S. equities and is meant to reflect the risk/return characteristics of large cap stocks. All cash distributions (e.g. dividends and income) are reinvested. Used as a proxy for "Stocks" above.
Barclay’s U.S. Aggregate Bond Index - A broad-based index of bond securities used to represent investment-grade bonds traded in the U.S. The index was formerly known as the “Lehman Aggregate Bond Index”. Used as a proxy for "Bonds" above.
CBOE Volatility Index ("VIX") - An index sponsored by the Chicago Board of Options Exchange (CBOE) that shows the market's expectation of 30-day volatility. It is constructed using the implied volatilities of various option expirations and various strike prices of S&P 500 index options.
Correlation (R2) - A statistical measure of how two financial instruments (e.g. securities, indices, etc.) move in relation to each other. A correlation of +1 implies that as one security moves, either up or down, the other security will move in lockstep, in the same direction. Alternatively, the closer correlation is to 0, the less the movements of two securities are related to one another.
Beta - A measure of the portfolio’s sensitivity to changes in the benchmark. A beta of 1 indicates the portfolio has historically moved with the benchmark. A portfolio beta greater than 1 indicates the portfolio has been more volatile than the benchmark and a portfolio beta less than one indicates the portfolio has been less volatile than the benchmark. Beta in this presentation is calculated using monthly historical returns.
Sharpe Ratio - A measure for calculating risk-adjusted return. The Sharpe ratio is the average return earned in excess of the risk-free rate per unit of volatility or total risk. Subtracting the risk-free rate from the mean return, the performance associated with risk-taking activities can be isolated. Sharpe ratio = (Mean portfolio return − Risk-free rate)/Standard deviation of portfolio return. For Sharpe Ratio calculations in this presentation, the “risk free rate” is represented by the annualized monthly returns of the 3 Month US T-Bill.
Max Drawdown - A measure of the largest single drop from peak to trough based on monthly portfolio returns
HFRX Absolute Return Index - A stock index designed to measure absolute returns. The absolute return index is actually a composite index made up of five other indexes. This index is used to compare the absolute returns posted by the hedge fund market as a whole against individual hedge funds.
Standard Deviation - A measure of the dispersion of a set of data from its mean.

Put Spread Selling Overlays in Core Bond Portfolios

Uncapped Upside While Hedging Equity Exposure